


Four Month Inflation Rate Hits 40 Year High
By Daniel R. Amerman, CFA
TweetWe're told that the United States is currently experiencing 12 month inflation rates like we have not seen in 13 years, and that much of the reason is the price recovery from the lows that occurred with the imposition of the economic shutdowns in the spring of 2020.
Using the same Consumer Price Index numbers but a different methodology, we will show in this analysis that the United States is currently experiencing the highest sustained rate of inflation in 40 years - not 13 years.
Four strong inflationary months in a row, March through June of 2021, have produced an annualized rate of inflation of 9.18%. This is the highest four month rate the United States has seen in 40 years. We have to go back to October of 1981 - in the midst of some of the highest rates of inflation in U.S. history - to get four months in a row of inflation that are as high as what we have just experienced.
The four months in question are not the result of a recovery from pandemic lows. Yes, the rolling 12 month measures that have been drawing attention have indeed been from a depressed base, the three months of price decreases in the spring of 2020 as the economy shut down, and this has led to a widespread "spin" that this is all just a recovery from those lows.
However, when we use a rolling four month measure, our starting point becomes the record high prices of February of 2021, long after the pandemic low of May of 2020, or the full price recovery that had occurred by August of 2020. The Consumer Price Index had already set seven consecutive all-time monthly highs, even before this powerful and sustained surge of inflation began.
This analysis is part of a series of related analyses, which support a book that is in the process of being written. Some key chapters from the book and an overview of the series are linked here.
A Powerful But Uncommon Inflationary Cluster
From August of 2020 through February of 2021, at a time when the Consumer Price Index (CPI-U, seasonably-adjusted) had already recovered from the pandemic lows, the monthly cost of maintaining a standard of living for an average urban consumer had been increasing in a range of about 0.12% to 0.35%. When annualized, these monthly measures are the equivalent of about 1.4% to 4.3% annual rates of inflation. These were somewhat higher than most of what had been seen through the 2010s, but not a great deal higher.
Then in March of 2021, the average price of goods and services in the U.S. jumped by 0.62%, which is an annualized inflation rate of 7.7%. This was the single largest monthly move in the CPI-U that we had seen since June of 2009. However, the June of 2009 jump was followed by a slight decrease in reported prices in July of 2009, so sharp one month moves don't necessarily mean all that much by themselves.
In April of 2021, the seasonally-adjusted CPI jumped by a larger 0.77%, which is an annualized 9.6% rate of inflation. In May, prices jumped another 0.64%, which is about an 8% annualized rate of inflation. Instead of a single one month surge, the highest one month rates of inflation since 2009 had now been repeated for three months in a row.
Then, instead of falling, in June of 2021 the reported rate of inflation rose still faster, to a 0.90% monthly rate, which is an annualized 11.4% rate of inflation, and the highest seen since June of 2008.
We have seen four consecutive strong one month increases in consumer prices, with every one of them being higher than any single month of inflation seen in over eleven years. How unusual is it to see four one month increases clustered together like that?
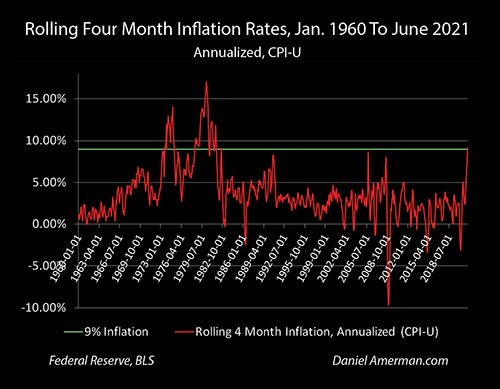
The reported increase in consumer prices was 2.97% over the four months, which is equal to an annualized rate of inflation of 9.18%.
The above graph shows just how uncommon those four consecutive high monthly rates of inflation have been. The red line shows rolling (annualized) four month inflation rates as measured by the Consumer Price Index (seasonably-adjusted) from January of 1960 through June of 2021, a period of just over 61 years. The green line is for comparison purposes, and shows a 9% annual rate of inflation.
The four month increase in consumer prices is the highest rate of inflation that we have seen since October of 1981, it is the only time there has been an annualized rate of over 9% in almost 40 years.
If we look back to 1981, those times seem almost surreal compared to today, with full year annual rates of inflation of 11.25% in 1979, 13.50% in 1980, and 10.38% in 1981.
Fed Funds rates averaged 19.10% in June of 1981 as the Federal Reserve desperately attempted to find a way to break the back of persistent and high inflation. The last time we saw a four month rate of inflation this high, thirty year mortgage rates reached an average monthly peak of 18.45%, in that same month of October of 1981.
It is also worth noting that going back to 1960, there had never been a four month rate of inflation as high as what we just experienced, until August of 1973. This already accelerating inflation would then be pushed still higher by the oil embargo of October 1973 to March of 1974.
We are truly in an unusual and deeply troubling spot. Going back 61 years, there was only one eight year period, 1973 to 1981 that had rates of inflation that were equal to what we are currently experiencing.
Feeding The Fire
Many people thought those terrible days were gone forever, others are too young to remember them at all. Even though the inflation is currently back, the greatest contrast between then and now is the attitude of the Federal Reserve and the United States government.
Inflation was considered an existential danger at the time. It was deadly serious stuff, and both the Fed and the government were committed to trying to fight inflation. For those of an age, 1974 was the time of the WIN buttons , "Whip Inflation Now", as the Ford administration tried to get the whole country to fight inflation together.
There were repeated recessions that were accompanied by inflation, stagflation became the rule of the day, there seemed no way out, and President Carter spoke of a national malaise, where the good times for the United States economy might be gone forever.
The years 1980 and 1981 were almost a photographic negative when it comes to Federal Reserve and U.S. government policies, they were the inverted opposite of what we are seeing today. Under Federal Reserve Chairman Paul Volcker, the Fed was committed to doing whatever it took, no matter how unpleasant the short term consequences, to break out of the stagflationary cycle it was stuck in.
Fed Funds rates were repeatedly pushed up over 19% in the year 1981, in the attempt to break the back of inflation, pulling money out of the economy. There were quick back to back recessions that hit the nation in 1980 and then again in 1981-1982, that were at least partially caused by the Fed's actions - but that was OK, if that was what it took to stop inflation. The stock market was reeling, the bond market was devastated, people were no longer buying homes or accepting transfers because they couldn't afford the payments on 18%+ mortgage rates - but it was all part of the price the government was willing to pay, the pain the nation was willing to go through, in order to end the nightmare. The pain lasted for years - but it ultimately worked - and we enjoyed the benefits for decades afterwards.
The contrast is extraordinary when it comes to the behavior of the Federal Reserve and the United States government today. The U.S. government was fighting inflation with everything it had as it desperately struggled to rein in out of control inflation in 1981, but yet when looking at a near identical rate of inflation in 2021, the Fed just continues to feed fuel to the fire, with easy money creation flooding the nation with cash. As described in the analysis from two months ago linked here:
"Keeping the dollars increasing and the spending up while the physical supplies shrink is like writing out a prescription for inflation - and that is exactly what we are seeing. There aren't enough supplies to go around, everyone has money to spend between the stimulus checks, enhanced unemployment checks and rising investment markets, and therefore the prices must rise and quickly."
There really shouldn't be any surprise factor. The Federal Reserve and U.S. government have been creating an ideal situation for high rates of inflation, with pandemic shutdowns and the related supply chain problems creating physical shortages, even while unprecedented deficit spending being funded by monetary creation floods the economy with cash.
This is a literal prescription for inflation, a formula for creating fast rising price levels. Inflation is indeed what we are getting, fast and hard. Yet, the political system is deeply wedded to policies of high government spending, easy money and very low interest rates. There would be a high political cost to reducing spending or substantially raising interest rates - and therefore the decision seems to be to just go forward, regardless of the consequences.
The political will in 1979 to 1983, with both Carter (who appointed Volcker) and Reagan, was to do whatever it took to somehow, someway find a way to bring inflation under control. The current attitude of the Fed and the administration seems to be closer to indifference, making a few noises about inflation, but not willing to bear any political cost at all when it comes to even reducing the rate at which fuel is being added to the inflationary fire, let alone trying to put out that fire.
Flipping The Formulas
Another way of looking at inflation is to not look so much at annual rates, or decreases in purchasing power, but just at the number of dollars it takes to buy things. The underlying foundation of inflation is an increasing numbers of dollars to buy everything, with ever more dollars being needed every year. From that underlying increase in the number of dollars, mathematical formulas can then be used to calculate rates of inflation, as well as decreases in the purchasing power of each dollar.
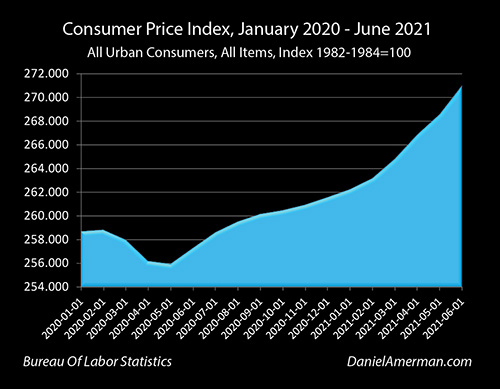
This raw data for the increase in dollars can be seen in the graph above. There is a very slight decrease in the money needed to pay for a standard of living for three months, during the height of the pandemic shutdowns, in March to May of 2020. There is a full recovery in prices by August of 2020, as the price levels of February are exceeded. And then when we go out from March of 2021, the slope distinctly changes, the rate of price changes increases - and on a cumulative basis, the area under the curve, the number of dollars involved begins to flood in on a faster basis.
For a typical saver or retiree, who is earning very little if any interest on their investments - the math that is involved is quite cruel. Many more dollars are required to buy most things. The dollars in the bank account do not keep up. In the short term, standard of living is reduced as prices surge while spending does not. Over the longer term, as one year becomes five years, and then ten years, and then twenty years, the process becomes one of relentless economic ruination, as the rewards of a lifetime of disciplined savings are destroyed with what could be called a callous indifference on the part of the government and the Federal Reserve.
On the other hand - formulas can work both ways. A government policy that is effectively a formula for creating an ever increasing flood of dollars for buying everything, can also be flipped into a historically proven and reliable formula for bringing dollars in at a rate well in excess of the rate of inflation.
As explored in Chapters 2, 3 and 4 in particular of Book 1 of the "Homeowner Wealth Formula" (Chapter 1 of Book 1 link here), when the government sets off an exponential increase in the number of dollars needed to buy everything, it also mathematically sets off a multiplication of the exponential increase in the number of dollars for investors who have aligedn their interests with inflation and higher rates of inflation. If we look back to the last time rates of inflation were this high, then as explored in Chapters 3, 6, 8 and 9 in particular of Book 2 (Chapter 1 of Book 2 link here), then what is being opened up is the potential for some of the highest and most reliable investor returns that we have seen in decades.
Moving to gold, when we look at sequence of returns risks and secular cycles for stocks and gold, then hitting a high rate of inflation just before or in the years immediately after retirement can be financially devastating for retirees. This means that tens of millions of Boomers are at potentially acute risk for their long term standard of living in retirement as explored in Chapter 20 of the free book (link here), with this inflationary wave building even as they reach their 60s and early 70s. At the same time, as explored in Chapter 21, for those who adjust and change their strategies, what history shows us from the 1970s and 1980s is that much more prosperous and long lasting retirement investment strategies - "virtuous circles" - can just as easily be created during times of high inflation, if the goal is to be in financial alignment with those times.
When we see the highest four month rate of inflation in the last 40 years, even as the government continues to feed fuel to the fire for short term political gains, then what we are seeing is a potential change in state - and the need for perhaps a complete change in assumptions. The 1970s and 1980s were supposed to be long gone, and few are prepared for a return to those rates of inflation (or higher).
When the major four month change in inflation analyzed herein is combined with the Federal Reserve effectively pawning a trillion dollars of the national debt to raise the cash to continue funding its easy money policies, as covered in the previous analysis (link here), then we have multiple warning signals going off in multiple areas at the same time. Some signals we haven't seen in close to half a century, and some we've never seen before. Hopefully this analysis has been helpful to you in sorting out what is happening in this time of rapid changes.
Learn more about the free book.
********************************************
We are living in extraordinary times, the world is changing fast. We have abundant, detailed historical evidence about the very best ways to make money in times of high inflation and economic distress. Indeed, we can track eight different levels of wealth multiplication, and see how they actually work, in a financial environment that works in quite different ways than what we have seen in the last four decades.
We also have a modern situation that is quite different from the 1970s and early 1980s. When we take the proven wealth creation formulas, and feed in more modern assumptions and parameters - then the ability to make money increases, as does the ability to find ways to substantially reduce risks while still keeping most of the returns.
This is not a time for platitudes, or over-simplifications, or the usual feeding of confirmation bias. We've got the actual evidence, and we know the detailed mechanics for how the wealth creation mathematics of asset/liability management in inflationary times work in practice. At the September "Home Wealth Formula For Investors" live workshop, we will be giving these subjects the time they need and discussing them in the detail they deserve, in a classroom atmosphere with like-minded people (brochure link here).
For those who are interested in learning more but not in attending the workshop, alternative financial education resources for distance learning include the books, DVD courses, and online video courses linked here.