


Chapter 17: How A Soaring National Debt Can Reduce Retirement Standard Of Living By 77%
by Daniel R. Amerman, CFA, MBA, BSBA
TweetOne immediate result of the economic damage from the coronavirus pandemic is a quick and almost fantastic degree of increase in the national debt, in order to pay for trillions of dollars in stimulus programs. Now, many people see the soaring national debt as being a political problem that could possibly lead to default or hyperinflation in the distant future - but they don't see the practical impact on their lives or investment decisions today, and they may therefore not see the relevance of these new trillions in debt.
This detailed analysis uses more than 50 years of data about the national debt and interest rates to demonstrate that the first quick doubling of the national debt to pay for the stimulus spending associated with financial crisis of 2008 has already transformed retirement investing and standards of living in retirement.
Using that historical information, we will develop the graph above in a step by step analysis. We will look at the example of someone who starts with $100,000, invests for 20 years, retires, and then draws down their savings over the next 20 years in retirement. As will be demonstrated for each $100,000 in savings - the full cost to that retiree of the growth in the national debt could be over a half million dollar reduction in their standard of living in retirement - and that is just for the first doubling, not including the impact of the coronavirus recession.
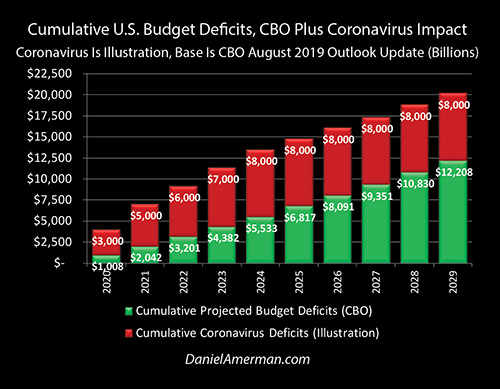
While events are still in the early stages and we don't yet know the full costs of the deficit spending that will be used to try to overcome the staggering economic costs of the coronavirus lockdowns, the somewhat conservative illustration shown above combines the planned cumulative deficits in green from before the pandemic, and adds on the cumulative cost of new stimulus spending in red. Using reasonably conservative assumptions, the national debt effectively doubles to over $40 trillion by the end of the 2020s.
This additional borrowing of close to $200,000 for every above poverty line household in the United States in the next ten years will be far from free. It will instead be one of the most expensive events of a lifetime for not just the nation, but on a very personal level for the citizens as well. This cost will be not be evenly borne, but as developed in the analysis, will instead be disproportionately paid for by reductions in future standard of living for savers in general, with the heaviest costs being paid by long term retirement investors as well for those retirees depending on retirement savings to support their lifestyles.
This analysis is the 17th chapter in a free book. The earlier chapters are of essential importance for achieving full understanding, and an overview of some key chapters is linked here.
Interest Rates & The National Debt Supercycle
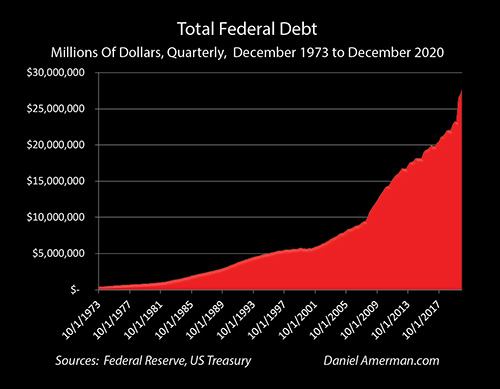
The graph above shows the amount of federal debt outstanding since 1973. As can easily be seen, the federal debt exploded upwards with the financial crisis of 2008, and began its meteoric ascent to the $23 trillion dollars outstanding even before the COVID pandemic. The national debt then leapt up again by another $4.5 trillion just in the year 2020, reaching $27.7 trillion by the end of the year.
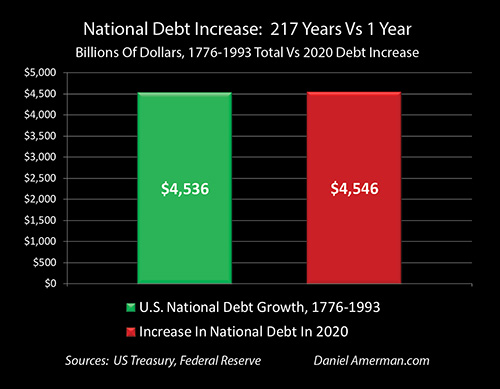
To put this in perspective, it took 217 years for the U.S. government to get $4.5 trillion in debt, from 1976 to 1993. That same amount of debt was run up in just 12 months in the year 2020.
Now ordinarily if we think about having our debts balloon out of control, we would expect to be making much higher interest payments.
That is, all else being equal, if our debt doubles or triples then our interest payments should double or triple.
As can be seen in the following graph, however, this hasn't been the case for the US government.
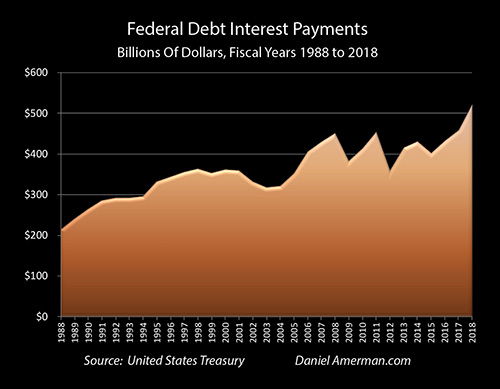
(Interest payments are on a fiscal year basis, which shifted from June to Sept.)
To the contrary, interest payments by the federal government were level or even falling ever since the financial crisis began through about 2017, and even now are just barely higher than they were when the debt was only around a third of its current size.
To understand why this is the case, we need to look at the national debt not on a simple dollar basis, but on an affordability basis. The taxes which pay for the debt can be seen as being a percentage of the size of the national economy. The larger the economy is relative to the size of the national debt, then the more taxes that are available to pay for the debt, and the more affordable it is.
Conversely if a nation has a very large debt relative to its economy, that would be like an individual with a small income owing large balances on a number of credit cards - the burden of the debt can be crushing, particularly with high interest rates. (This is not mean to be taken too literally but as more of an analogy.)
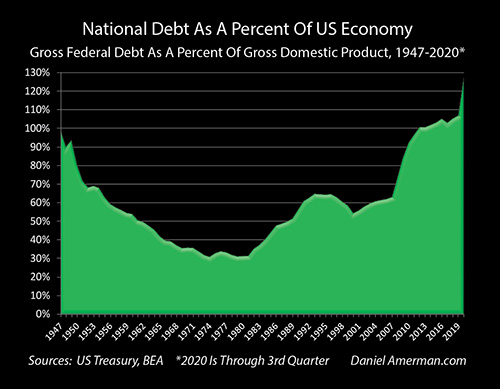
The graph above shows the size of the national debt relative to the U.S. economy since 1947. What it shows is a supercycle that takes place over a period of decades. The national debt was very high relative to the economy in the aftermath of World War II, as a result of the money borrowed to pay for that war. It fell (relative to the economy) and was much lower for many years before beginning to rise again in the 1980s. The national debt then exploded upwards during the Financial crisis of 2008 and the trillion dollar plus annual deficits that followed, shooting up far faster than economic growth.
All else being equal then, the interest payments on the debt should have more than tripled since 2007 in dollar terms, and more than doubled relative to tax revenues or the size of the economy. But, instead, they barely budged in dollar terms, and the graph below shows why.
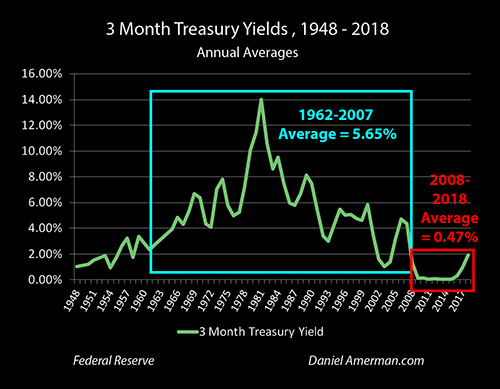
What is shown in the graph is the 3 month Treasury yields - the interest rate the government pays to borrow money for three months, on an annual average basis since 1948. When we look at the 1962 to 2007 period when the national debt was on average equal to only 44% of the size of the economy - the Federal government paid an average of 5.65% to borrow money. However, during the 2008 to 2018 period, the green line of interest rates plunged and the average borrowing cost fell all the way to 0.47%.
At the very same time, savers and investors have also been experiencing these very low interest rates.
Government Interest Rate Interventions
Now if someone viewed the federal government's being in debt as being similar to an individual being in debt, they might wonder if this just comes down to extraordinarily good luck. To have interest rates plunging even as the amount of debt outstanding was soaring upwards!
And generally speaking, this is where a lot of confusion can occur when trying to understand the debt and the deficit, because indebted national governments that can borrow in their own currencies are nothing whatsoever like individuals or corporations being in debt.
In the case of the United States, interest rates have been controlled for some years now through the actions of the Federal Reserve.
That is, as illustrated in the graph below, at the very same time that the federal deficit has been soaring, the Federal Reserve has been quite literally creating trillions of dollars out of the nothingness and using this brand new money to purchase United States debt – not directly from the US government, but through the markets.
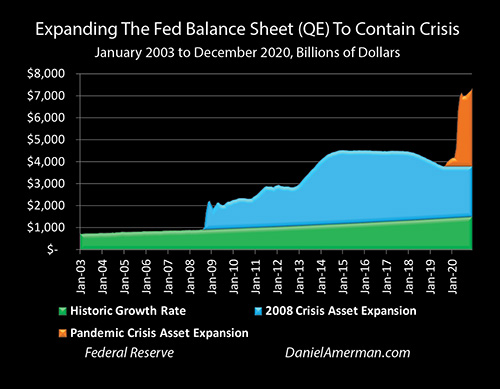
In doing so, the Fed has taken control of interest rates in the United States.
Thus there is nothing fortuitous or "lucky" about the current very low interest rates – but rather they are a direct result of governmental policies.
Borrowing To Make Interest Payments
Given its sheer size, if the interest rate on the national debt were to rise by even 1%, the annual federal deficit rises by $220 billion. A 2% increase in interest rate levels would up the federal deficit by $440 billion, and if rates were 5% higher, the annual federal deficit rises by a full $1.1 trillion per year.
However, that is just simple interest. The real problem is that particularly in recent years, on an annual basis the U.S. does not collect sufficient taxes to make interest payments on the national debt - so it borrows the money to make those payments. (Monthly surpluses can occur when annual taxes and quarterly withholding taxes are collected, but those disappear on an annual basis.)
So, to return to our credit card analogy - the U.S. government could be likened to an individual who is not only spending more than they take in, but is also borrowing all the money to make their monthly payments. The higher the interest rates paid, whether on the credit cards or the national debt, then the more money that has to be borrowed to make each payment, and the faster the debt spirals upwards.
In other words, the federal government has a compound interest problem. This means that as the national debt grows ever larger relative to the economy, and all the interest payments on that large debt need to be borrowed - higher interest rates can cause much larger increases in the debt than most people realize.
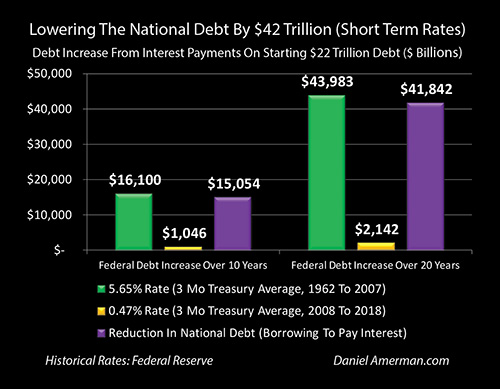
The above graph is a simplified example of how the future debt can change depending on the level of interest rates. We start with a $22 trillion national debt, and assume that the only increase in the national debt comes from the borrowings to make the interest payments on that debt. For the green bars, we look at the actual average 3 month borrowing rate on the debt from 1962 to 2007 of 5.65%, assume that the government borrows the money to make those interest payments each year, and then borrows the money the next year to make the interest payments on the money previously borrowed to make interest payments (and so forth).
At the end of ten years (the left side of the graph), the U.S. government would have incurred another $16 trillion in debt, solely as a result of borrowing the money to make average interest payments on the starting $22 trillion debt - and the total debt would be up to $38 trillion. This would be without even one dollar of additional deficit spending over those ten years, beyond the borrowed interest payments.
On the other hand, with the very low 0.47% interest rates that we actually had in the 2008 to 2018 period as the national debt soared - the total additional debt after 10 years would be "only" $1 trillion, as can be seen with the yellow bar above. Going to extremely low interest rates has effectively wiped out the Federal government's compound interest problem.
The purple bar shows the reduction in the future size of the national debt as a result of lower interest payments on our $22 trillion debt. The debt would have grown an additional $16 trillion with merely average interest rates, but only grows $1 trillion instead - so very low interest rates keep the national debt at a level $15 trillion below what it would otherwise would be.
For comparison purposes, the national debt did not reach $15 trillion until the year 2013. So what is at stake for the government in keeping extremely low interest rates over just the next ten years exceeds the total borrowings by the U.S. government in over 200 previous years (in nominal dollars anyway, not adjusting for inflation).
What is a big problem over ten years becomes a much bigger problem over twenty years - and this a particularly relevant concern for someone who is making financial plans based upon receiving Social Security payments in full during the period between 10 and 20 years out.
***************************************************

Read Chapter One Of "The Homeowner Wealth Formula"
Read Chapter One Of "The Eight Levels Of Homeowner Wealth Multiplication"
***************************************************
Twenty Years Of Borrowing To Make Interest Payments
When we move to the right side of the graph, and look at historically average short term interest rates, the cost of borrowing to make interest payments, and then borrowing to make the interest payments on money borrowed to make interest payments - we get the green bar. The increase in the national debt needed to make the interest payments on a starting $22 trillion debt at a historically average 5.65% rate over 20 years is an astounding $44 trillion.
So, if the federal government were to only borrow the money to make historically average interest payments on the starting $22 trillion debt over the next 20 years - and not one dollar more for any other spending - that would be enough by itself to triple the national debt up to $66 trillion.
However, if over the next 20 years the United States government and the Federal Reserve were to together succeed in keeping short term interest rates at where they have been in the 2008 to 2018 period - at an average of 0.47% - then the 20 year increase in the debt would "only" be the $2.1 trillion seen with the yellow bar.
Therefore, what the U.S. government has at stake over the next 20 years - is preventing a potential increase in the national debt that is almost twice what the current total national debt is. As shown with the purple bar, the value to the government of keeping an average interest rate of 0.47% instead of a more historically normal 5.65%, is sufficient to reduce the national debt by $42 trillion, in comparison to what it would otherwise be.
This $42 trillion reduction in the future national debt is far from free, however. It comes with a devastating price for retirement savers and retirees living off of their savings, and with a potentially catastrophic reduction in the standard of living that can be paid for with risk-averse investment strategies.
How Retirement Savers Pay The Price For Large National Debts
As covered in previous chapters, underneath everything else - the short term risk free interest rate is a dominant influence on almost all financial prices and returns. Longer term interest rates, CD rates, money market rates, corporate and municipal bond rates, mortgage rates, and even stock dividend yields and real estate capitalization rates can all move with changes in the underlying short term risk free rate.
While perhaps less intuitively obvious for those who are not financial professionals, stock prices, bond prices, home prices and gold prices can all be profoundly influenced by changes in the short term risk free rate. Indeed, when we look at the distorting effects of the long term and massive change in interest rates needed to keep a $22 trillion national debt from exploding upwards out of control, there is not one aspect of long term investing for retirement that is immune. When the national debt is so large and is growing so fast, it is arguably impossible to make good financial plans without incorporating this "800 pound gorilla in the room", and one of the purposes of this book is to help readers understand the many ramifications.
In this particular chapter, to keep this as simple as possible - while still being entirely real world and accurate - we will look at the mirror side of what the government is doing, which is a risk-averse person who is saving for retirement. While what is shown is a saver investing in 3 month Treasuries (or funds investing in similar instruments), the implications are much broader, and include CD rates, money market yields, and other short term instruments that have very little credit or price risk.
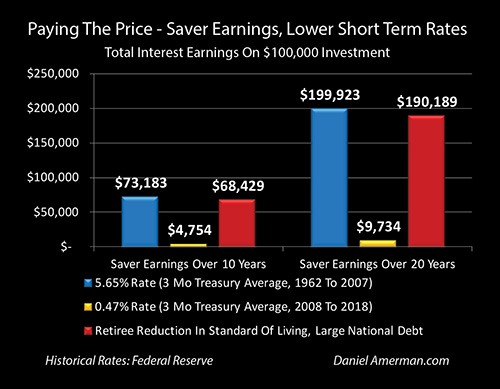
If someone has $100,000 in savings, and they were to invest that money for 10 years at the average 5.65% interest rate that prevailed between 1962 and 2007, when the national debt on average equaled only 44% of the size of the economy - then they would earn a total of $73,183 on their investment, as shown with the blue bar. This would include the simple 5.65% interest payments, and then the compound interest as those payments are reinvested and earn interest themselves.
This ability to build wealth with compound interest (even while taking almost no credit or price risk) worked for decades, likely for most of the lives of most of the people reading this, and became built into the conventional wisdom underlying financial planning. It was just taken for granted, as being the natural state of things.
However, the rug was pulled out from underneath many millions of investors and retirees when the financial crisis happened in 2008, the national debt exploded upwards, and the Federal Reserve contained the crisis with extremely low interest rates - an action that also had the crucial effect of keeping the soaring national debt affordable.
The compounded interest earnings on a $100,000 investment over ten years at the 0.47% historical average rate experienced between 2008 and 2018 - is only $4,754 as shown with the gold bar. There is a crippling destruction in retirement savings income, with the saver losing $68,429 of their money available for spending in retirement, as shown with the red bar.
A Mirror Relationship
What we are seeing is the mirror relationship between large national debts and the ability of savers to safely build wealth for retirement. As shown for the government in the first graph, lowering interest rates from 5.65% to 0.47% reduces the future increase in the national debt in 10 years by about $15 trillion, which is about a 94% reduction.
At the same time, for many millions of individual investors and as shown in the second graph, interest rates being forced down from a long term average of 5.65% to the 0.47% experienced on average between 2008 and 2018, had the impact of lowering earnings on a $100,000 investment in 10 years by $68,429, which (of course) is also about a 94% reduction.
Part of the reason for using actual historical numbers is to emphasize that this is not a theoretical relationship - this happened for real, it is happening right now, and it is highly likely to continue into the future. It has been eleven years since the financial crisis and the Federal Reserve slamming interest rates down to near zero percent, even as the national debt exploded upwards.
During that time, for the many millions of investors who were invested in very short term near risk free financial instruments, including money market funds, short term CDs (and interest-bearing savings and checking accounts), they have lost somewhere between 90% to 95% of the interest income they would have enjoyed in previous decades. This is trillions of dollars in very real lost money, that does not now exist, and will not be available for future spending.
Mirroring the increased savings on the national debt, however, the farther out we go in time, then the greater the damage for savers and investors. Going to the blue bar on the right side of the graph, based upon the average 5.65% interest rate that prevailed between 1962 and 2007, a saver could expect to earn almost $200,000 on a $100,000 investment over 20 years. They could expect to almost triple their money without taking risk, and that was the unquestioned norm. (Of course, this does not include inflation, but taking inflation into account actually makes the comparison much worse, as will be developed in later chapters.)
However, with the 0.47% average rate actually experienced in the 2008-2018 period, the total earnings would drop to a mere $9,734, as shown with the gold bar. This is a catastrophic decline of about $190,000, as can be seen in the red bar showing the retiree reduction in standard of living associated with investing in a time of very high national debts.
The Impact On Longer Term Rates
Not all of the national debt is borrowed at very short term interest rates - and not all investors invest only in short term instruments. There has also been a profound change in long term rates, and these changes have even larger consequences for a heavily indebted nation, as well as for savers.
The average yield on 10 year Treasury obligations between 1962 and 2007 was 7.04%. During the time between 2008 and 2018, these yields declined to an average of only 2.61%.
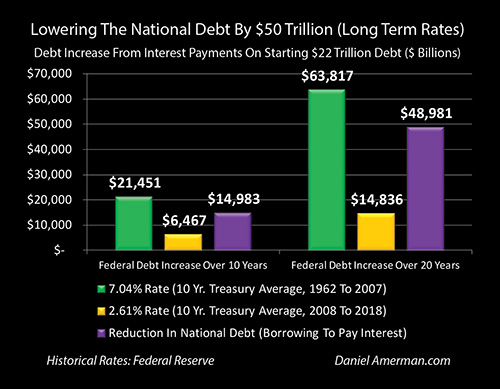
As can be seen with the left green bar, paying a historically average 7.04% interest rate and borrowing the money at 7.04% to make those interest payments, would be almost enough to double the national debt by itself in the space of ten years, increasing a $22 trillion national debt by about $21.5 trillion.
Even with the very low 2.61% ten year average yield between 2008 and 2018, the federal debt would increase by $6.5 trillion over 10 years, as can be seen with the gold bar. However, the purple bar is about the same as it was with short term interest rates - very low longer term interest rates have the effect of keeping the national debt down to a level that is about $15 trillion less over the next ten years, than it would be with historically average rates.
The higher the interest rate and the greater the number of years - the greater relative power of compound interest. This can be clearly seen in the right green bar, where paying a historically average interest rate, and borrowing the money to do so, would increase a starting $22 trillion debt by about $64 trillion over the span of about 20 years.
This extraordinary increase in the debt is again quite conservative, as it includes only the borrowing to make interest payments, and does not included any other deficit spending by the federal government over those years. But even with that very conservative assumption the national debt still almost quadruples over 20 years, from $22 trillion to $86 trillion, solely from the problem of borrowing the money to pay historically average longer term interest rates.
However, with the much lower interest rates since 2008 - the national debt would "only" grow by $15 trillion over 20 years. In other words, so long as long term rates are much lower than historical averages - then the national debt is almost $50 trillion less in 20 years, as can be seen with the purple bar. Conversely, the price of historically average interest rates for a heavily indebted nation that is borrowing just to make interest payments - is a near $50 trillion increase in the national debt.
Savers & Longer Term Rates
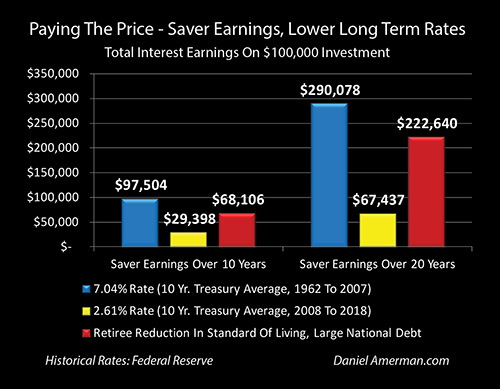
When we flip to the other side and look at the impact on savers - then an investor taking no credit risk by investing in ten year Treasuries at a historically average 7.04% rate for ten years - could expect to almost double their money, earning almost $100,000 on their initial $100,000 investment. About $68,000 (i.e. two thirds) of their gains disappear, however, with the very low interest rates of a heavily indebted nation, leaving the investor with only about $29,000 in income over ten years.
The highest price a of a very large national debt can be found for investors who are buying longer term investments with their (usually) higher rates, and holding them for longer periods of time. The historical norm, with average interest rates during the decades between 1962 and 2007, was for an investor to be able to almost quadruple their money over 20 years, earning $290,000 on top of a $100,000 investment by earning compound interest at a rate of 7.04% on U.S. Treasury obligations.
However, with the 2.61% average yield from 2008 to 2018, the investment earnings over 20 years fall to only about $67,000. This means that the reduction in retirement savings as a result of living in the times of a large national debt is about $223,000 - which is getting close to a quarter of a million dollars.
So, how exactly can a nation that is $22 trillion in debt avoid adding almost an additional $50 trillion to the national debt over the next 20 years? The way it is done is by taking an individual who has $100,000 in savings, and reducing their interest income by close to a quarter million dollars over the next 20 years. And then multiplying that near quarter million dollars in lost standard of living by millions of other investors, with some having less to invest and others having more.
Lower Payouts On Lower Savings
While the amount of money that someone has saved when they retire is important, it is not the only factor determining how much cash is available to support standard of living in retirement.
The earnings rate when someone has already retired is also of critical importance. The more money that is being earned, then the less money that needs to be taken from the body of the savings each year. This then means more money in each of the following years, as there is a higher earnings rate on a larger amount of retirement savings.
Conversely, if there is a low earnings rate, then most of the money being spent in an individual year has to come from the body of the savings rather than income. This then presents retirees with the cruel dual dilemma of savings that are then falling far faster than they otherwise would, even as the income on those savings are much lower.
To truly see the full impact of a very large national debt on retirement standard of living, we need to include not only the smaller amount of savings entering retirement, but also the lower amount of money that can drawn down each year during retirement with lower rates.
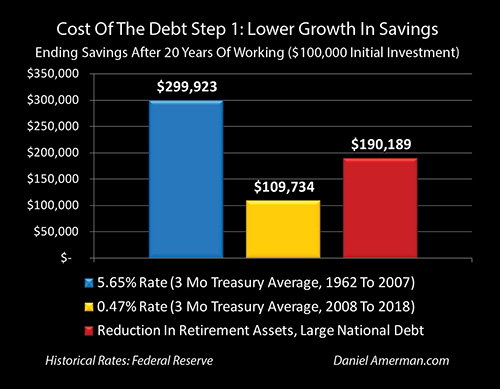
As a first step, we will look at the money available for someone who has invested $100,000 for 20 years in short term, high quality investments such as money market funds, short term CDs - or the three month Treasury yields shown above. If we look at someone investing at the historically average interest rate from 1962 to 2007 of 5.65%, when the national debt was much more affordable relative to the size of the economy, then $100,000 would have turned into almost $300,000, and those would be the available financial resources starting retirement.
(This is very similar to the first graph of saver income, except this time we are including having the initial $100,000 investment available to spend during retirement.)
However, with the 0.47% average interest rate seen since the financial crisis, the heavy-handed Federal Reserve interventions, and the ballooning of the national debt - the investor would get their $100,000 back and only a little more, with a little less than $10,000 in earnings over the 20 years.
This means that the reduction in retirement assets as a result of investing in a time when a very large national debt requires very low interest rates - would be about $190,000.
If we are looking at a $100,000 investment being made by a 45 year old individual who retires at age 65, then the impact of a very large national debt on retirement assets would be a reduction of 63% in savings entering retirement. Leaving rates constant (they may go lower in the years to come), this could apply to someone is 45 today - or to someone who was 45 in 2008.
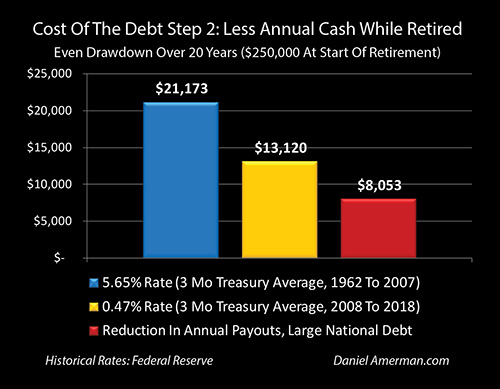
For step two, we will isolate how lower interest rates reduce the amount of money that can be used to support annual standard of living in retirement. If we assume a $250,000 retirement account size at retirement, and a 65 year old who wants a level annual income for the next 20 years, then at a historically average 5.65% interest rate they would be able to draw down their savings at annual rate of $21,173 over the following 20 years, with the money not running out until the end of the 20th year.
This person would earn $14,125 in interest in their first year of retirement, and would take $7,048 out of the body of their savings, in order to get that first year cash flow of $21,173. (These are annual computations for simplicity, and do not include inflation.)
On the other hand, when we look at the average 0.47% interest rate between 2008 and 2018, then first year interest earnings on the $250,000 starting savings are only $1,175. This means that to support even a much lower drawdown amount of $13,120, an investor in this modern environment would need to take out a much higher $11,945 from the body of their savings, and would have even less savings to earn the much lower interest rate upon the next year.
The interest rates during a time of much lower national debts would have allowed a retiree to spend $21,173 per year in retirement for 20 years before their money ran out, for a total of $423,460 in money to support their standard of living.
The much lower interest rates needed to keep the national debt from spiraling out of control would allow a retiree to spend $13,120 per year for 20 years for a total of $262,400 to support their standard of living in retirement.
Looking at the red bar of the reduction in annual payouts as the result of having a very large national debt, the saver would lose $8,053 in available cash per year, and a total of over $160,000 in lost standard of living between ages 65 and 85. This is however based upon savers having the same amount of cash available when they start retirement - and if they had been investing during a time of large national debt, they would have less.
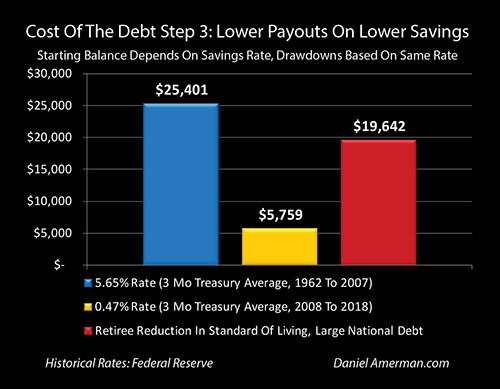
For our third step we need to combine the first two steps, and look at lower annual payouts on lower retirement savings.
For a saver who invested $100,000 at age 45, and earned the average yield on 3 month Treasuries between 1962 and 2007 - they would have had $299,923 when they started retirement at age 65. If they earned that same average 5.65% rate while evenly drawing down their savings over 20 years, they would have had $25,401 a year to support their standard of living in retirement .
For a saver who had the identical $100,000 in savings at age 45, and made an identical investment in 3 month Treasuries, but this time at the yields associated with a very large national debt - they would have had $109,734 when starting retirement at age 65. The drastic reduction in interest earnings at a 0.47% rate would have then required them to draw down the body of their savings at a much higher annual rate, and the total cash available each year to support their standard of living in retirement for the next 20 years would be only $5,759.
The cost of the very large national debt for this retiree would be the almost $20,000 per year reduction in annual spending in retirement, as seen with the red bar.
A 77% Reduction In Retirement Standard Of Living
The graph below summarizes the three steps for determining how a very large debt can substantially change standards of living in retirement for an entire nation, and this time the information is presented in percentage terms.
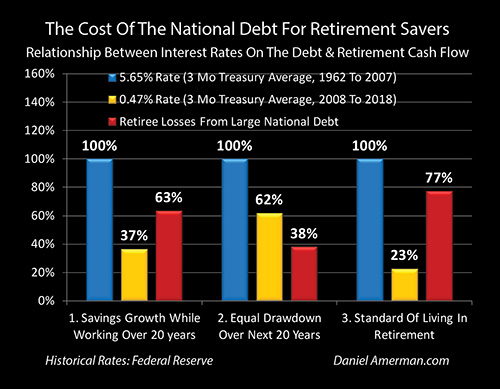
The blue bars show how each investment step worked with the 5.65% effectively risk free rate that was the average between 1962 and 2007, a period in which the national debt was less than half what it has been since 2008 (relative to the size of the economy).
For step one, reducing the rate to the 2008-2018 average of 0.47% means that for someone who invests at age 45, and works for 20 years, they will end up with only 37% of the assets starting retirement that they would have had with normal rates, and having a very large national debt costs them 63% of what should have been their retirement savings.
For step two, over the next 20 years during retirement, with the lower interest rates associated with a very large national debt, a retiree who was drawing down their savings on a level basis over 20 years would only get 62 cents on the dollar, compared to what they would have had with the historically average interests associated with a lower national debt. This represents an annual reduction in retirement standard of living of 38%, compared to the longer term average with more normal rates.
For step three, we combine the 63% loss during the 20 years of investing for retirement, with the 38% loss during the 20 years of drawing down savings in retirement. We are left with 37 cents on the dollar after the losses of the first 20 years, and then we only get 62 cents on the dollar for that 37 cents in annual cash flow over the next 20 years, so on a combined basis, the retiree would only have 23% (37% X 62%) of the cash to support their standard of living in retirement - and 77% of their cash would have been lost to the much lower interest rates required by the much larger national debt.
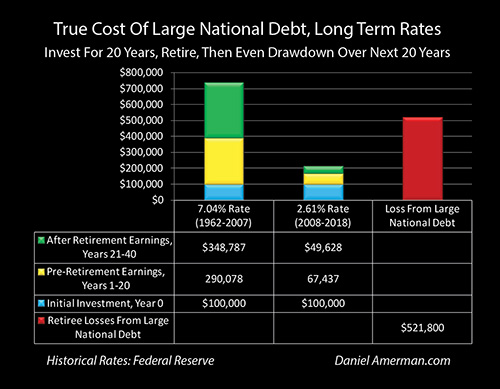
Total Earnings, Before & After Retirement
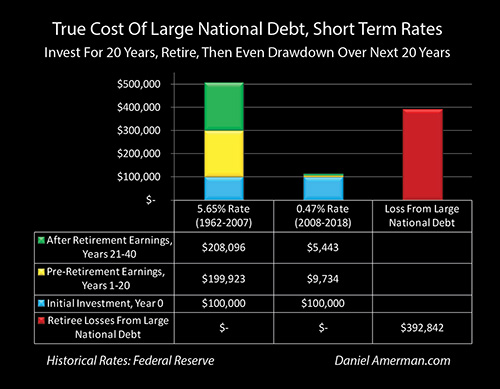
The above graph and table shows the true cost of the very large national debt in terms of total dollars over the 40 years, with short term 3 month Treasury yields. The blue bars are the starting $100,000 in each case. The yellow bars are the earnings over the first 20 years, before retirement. The green bars are the earnings over the next 20 years, after retirement.
In normal times, with a normal national debt and normal interest rates, even when looking at very high credit quality investments with effectively no risk - the overwhelming majority of the money available to spend in retirement is not the money saved, but the money earned on those savings. One hundred thousand dollars is saved, then almost $200,000 is earned before retirement, and another almost $210,000 is earned after retirement. So a little over 80% of the $508,000 spent in retirement is not directly from the money saved - but the earnings that come from investing that money while following a disciplined approach over a 40 year period.
That is how financial planning is supposed to work, and that is how the world is supposed to work.
However, when we take into account the extremely low interest rates the Federal Reserve forced on the nation in the attempt to contain the damage from the financial crisis of 2008 - which simultaneously kept the national debt from growing to a much larger level by now than "just" $22 trillion - then, the big yellow and green bars of earnings collapse to barely visible slivers in the second stacked bar. And, as shown with the red bar on the right, there is an almost $400,000 loss of retirement standard of living.
Of course, for many people this wouldn't happen - they would take some risk instead. Risk is risk, there is no getting around it, no matter how much rationalization may be involved in doing what needs to be done. That said, the simplest way of taking some risk without taking too much risk, would be just invest longer term, while keeping the lack of credit risk, and this would mean returning to our other historical yield analysis, that of investing in 10 year U.S. Treasury obligations.
The Full Cost Of The National Debt
When we look at the stacked middle column with the 2.61% average ten year yields between 2008 and 2018 - there is a lot more yellow for interest earnings before retirement, and a lot more green for interest earnings after retirement. Putting those together, the amount of money for retirement has almost doubled relative to the short term investments, and more than half of the money now comes from earnings rather than directly from money saved. Those are certainly improvements.
However, the gap when compared to standard of living in retirement with historically normal interest rates is now wider than ever. Starting with the same $100,000 investment at age 45, and investing in the identical securities (10 year Treasuries), there is now more than a half million dollar cost to a retiree's future standard of living, as a result of the much lower interest rates required on a much higher national debt.
When we take a closer look, however, the situation is actually worse than that. Let's take a very close look at the green bar of interest earnings in retirement with historically normal interest rates of 7.04%. Notice that there are more interest earnings after retirement ($348,787), than there are before retirement ($290,078).
What this shows is a critically important component of financial planning and achieving financial security in retirement - the investment decisions made after retirement can actually be more important than the decisions before retirement (particularly when the retirement is longer than the example 20 years). Unfortunately, this is also where a very large national debt can have the most negative impact on financial security in retirement.
Now, compare the before and after retirement earnings with very low interest rates. There are materially less interest earnings after retirement, only about $50,000, instead of the $67,000 earned before retirement. This is the reverse of what we see with normal interest rates. While the difference may seem a bit arcane, in practice this is likely to change quality of life, fears and stress in retirement in ways that go well beyond just simple dollar comparisons.
The difference is that with higher interest rates, most of our standard of living in the early years comes from the interest earnings. However, when we start with much less money because of a high national debt, and then we have much lower interest earnings on that money - then as previously mentioned, we have start draining the body of our retirement savings at a much faster rate, there is no alternative.
This decreases our financial security in each year - and heightens one of the central problems with retirement investing, which is not knowing how long we will live. With a larger portfolio and historically normal interest rates, we could make the choice to dial back the standard of living a bit, just live off the interest income, and keep all or most of the body of our savings intact (or at least slow down the annual depletion). So if we live to 90 or well beyond, we can still live out our remaining years with a reasonable standard of living and security.
However, with a much smaller amount of savings and much lower interest rates, there may be no choice but to more rapidly drain the savings. This creates a much greater conflict for those who live at least a little - or perhaps a lot - beyond average, and substantially increases the chances of the final years being lived in something close to poverty. This can also create extraordinary stress for a retiree who is fully aware of what is happening, but has little they can do about it, other than preemptively slashing their standard of living even further for what years they do have, just in case they do live longer.
When we look at the full cost of a $22 trillion national debt for an individual retiree then we do have the central and life changing issue - which is that $100,000 in savings could end up providing half a million dollars less to spend in retirement, and thereby radically change our standard of living.
But, beyond that, we also have a much more rapid draining of what savings we do have, greater financial issues associated with living a longer life, and a materially greater chance of just plain running out of money with there being very little we can do about it. This will create greater risks - and much higher stress levels and fears in retirement - than would be the case with the higher earnings associated with lower national debts.
The cost of the national debt is not theoretical or abstract, and it doesn't just occur far in the future with some assumed default or bout of hyperinflation. Instead, the cost of the national debt is very real and deeply personal, we are paying it right now, we have already been paying it for years, and it is likely to have a much more powerful impact on all of our lives over the coming years and decades. Take each of the issues explored herein, multiply them by millions of savers - some with less to invest and some with more - and we get the true cost of a very large and fast growing national debt for the country.
Much Lower Rates & Much Higher Asset Prices
While everyone has been living with much lower interest rates since 2008 - polling shows that the average retiree and retirement investor nonetheless still feels quite comfortable when it comes to their financial security in retirement at this point.
And when we look at the asset prices below in comparison to historic norms - why not? Stock valuations, bonds, homes, and gold are at historically elevated levels, and are 30% to 50% above long term averages, as show in the graph below from Chapter One.
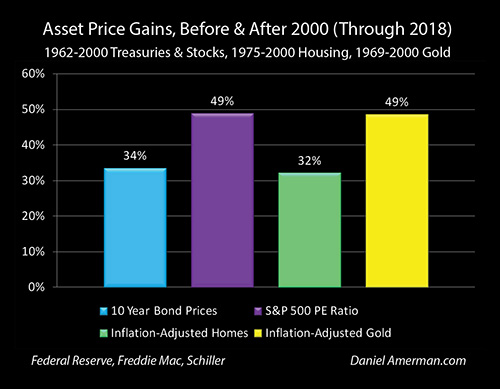
While these soaring asset prices have left many investors not too concerned about very low annual cash flows, what needs to be understood is that the very high asset prices are themselves another flip side of very low interest rates, as developed in Chapter One of this book (link here).
Indeed, when we combine what was learned in earlier chapters with what was explored in this chapter - there is a case to be made that one of the main side effects of a soaring national debt is stock and home prices that are much higher than they would otherwise be. While this may sound deeply counter-intuitive for those who have not read the previous chapters - I am hoping that for those of you who have been reading along, it will make quite a bit of sense. As the national debt continues to rapidly rise, this carries some very interesting implications for housing and investment decisions.
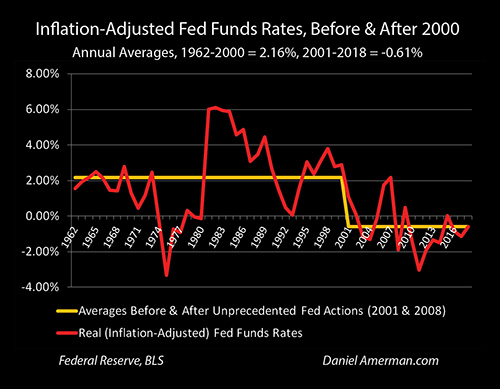
Something else of importance is to fully take inflation into account, as shown in the graph above from Chapter One. The relationships between the national debt, interest rates, inflation, and inflation-adjusted standards of living in retirement will be the subject of later chapters.
In previous chapters we explored how very low interest rates have become an existential need for the Federal Reserve when it came to containing the crises and recessions that resulted from the collapse of the tech stock bubble, and then the Financial Crisis of 2008. In this chapter we explored why very low interest rates have become an existential need for the United States government, in order to keep the deficits and national debt from spiraling upwards at much faster rates than they currently are.
So which is it that drives very low interest rates? Is it the Fed containing recessions and economic damage? Or is it the government trying to hold down deficits and the debt?
The answer is both. The Federal Reserve must keep interest rates low for economic and market reasons. The United States government must keep interest rates low for national debt reasons. And each of these needs is subject to amplification as the debt continues to rise, or as another potential recession looms.
The two existential needs wrap around and reinforce each other, and as of 2020 they began to merge in a way that they never have before, as we will be exploring.
Learn more about the rest of the free book.
***************************************************
Read Chapter One Of "The Homeowner Wealth Formula"
Read Chapter One Of "The Eight Levels Of Homeowner Wealth Multiplication"