


Gold Had A Strong 2019, But The Disconnection From Inflation Continues
By Daniel R. Amerman, CFA
TweetGold in 2019 had its best year since 2011, if we look at percentage gains on inflation-adjusted average annual values.
The average annual price of gold (in 2019 dollars) was $1,292 an ounce in 2018 and $1,392 in 2019. This was a 7.7% gain, and was the largest annual gain since the 24.1% gain in 2011.
But yet - gold did not in fact behave in the way that most gold investors expected it to. The way that many people see it, gold is supposed to be an inflation-based instrument, an inflation hedge and perfect store of value.
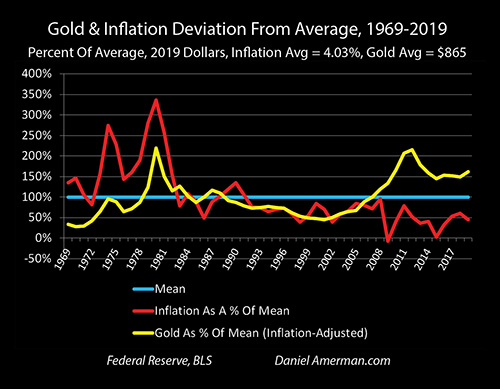
As can be seen in the graph above and as we will explore in this analysis, gold moved in the opposite direction of inflation in 2019, with the yellow line of gold prices experiencing its best year since the aftermath of the Financial Crisis of 2008, but with the red line of annual average inflation moving downwards compared to long term averages.
Gold started well above its long term average value in inflation-adjusted terms. Inflation started well below average, and then moved even further below average. So... if gold prices are supposed to move with inflation, and inflation starts well below average, and then moves still lower, why would gold prices start well above average, and then have their best year in 8 years while inflation was falling?
Now, if something besides inflation is creating the largest gold gains in 8 years - let me suggest that it would be really, really good for gold investors to fully understand what that source of gains is, if it isn't solely inflation.
This analysis is part of a series of related analyses, which support a book that is in the process of being written. Some key chapters from the book and an overview of the series are linked here.
The Break With The Past Continues
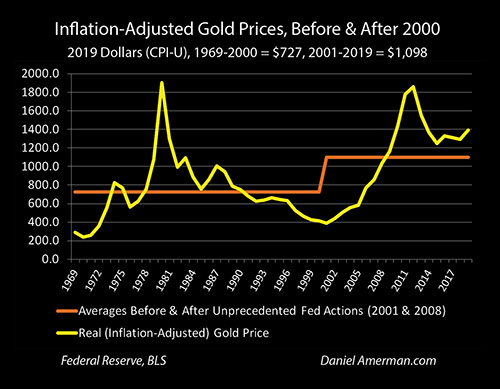
The graph below was developed in Chapter 16 (link here), and as explored in that chapter, over the last fifty years gold has not in fact been acting as perfect money or a stable store of value. Instead the yellow line of the inflation-adjusted value of gold has fluctuated wildly over that time period.
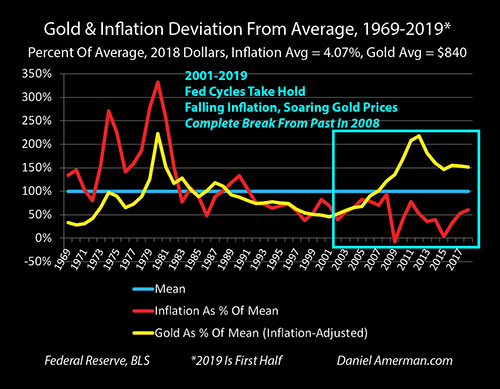
If we examine the left side and middle of the graph, as was done in Chapter 16, then we find a much better predictor. If we look at gold not as a stable store of value, but as an inflation-based investment whose price is driven by supply and demand, then the inflation-adjusted price of gold should rise with rising inflation, and fall with declining inflation. And indeed, for almost 40 years between 1969 and 2007, that relationship worked very well, with a great deal of explanatory power.
However that relationship completely broke down after 2008 - the same time period when the Federal Reserve:
1) for the first time introduced reserves based monetary creation, thereby changing the nature of money and the U.S. dollar;
2) used the new money to fund trillions of dollars in quantitative easing and widespread direct market manipulations for the first time; and
3) forced interest rates down to zero percent, which was below the rate of inflation, which that meant that real (inflation-adjusted) interest rates became negative.
The Federal Reserve through its extraordinary and unprecedented interventions changed the very nature of money and the markets in the United States - and gold has never been the same since, the correlation between inflation and gold prices has almost completely broken down.
And now that we have the annual data for 2019, what do we see? As shown in the graph repeated above, it is a crystal clear confirmation that gold prices are indeed being determined by something besides the traditional tight relationship with inflation. The yellow line of gold prices shooting upwards with the biggest gains since 2011, even as the red line of inflation moves downwards, clearly shows that the complete break with the past that began with the Fed's extraordinary interventions in 2008 continues through today.
Changes In Money & Rates In 2019
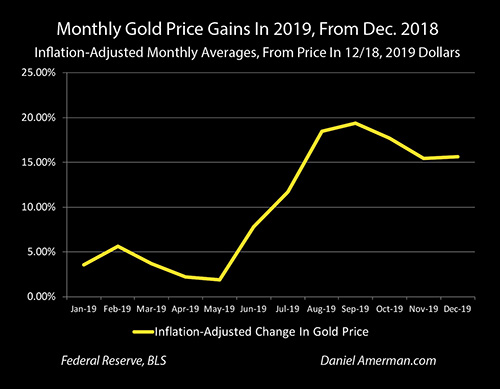
The graph above shows the inflation-adjusted price gains for gold in U.S. dollars on a month by month basis over the course of 2019, when compared to the average price of gold in December of 2018.
As is readily apparent, the big gains in gold began in June, and peaked at almost 20% by September. While some of the price gains have been given back, the gains remained at over 15% through the rest of 2019.
What else happened around that time? The Federal Reserve got in a great deal of trouble.
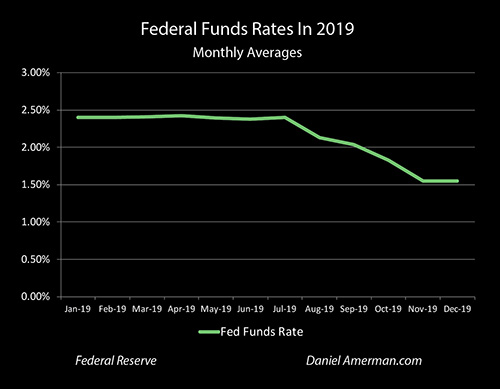
The Fed started the year intending to raise rates 3-4 times, but had to pause in order to avoid triggering a potential recession, stock market crash, and housing market crash.
Instead - for the first time since 2008 - the Fed reversed directions, and moved rates downwards, three times before the end of the year. And gold experienced its largest annual gain since the aftermath of slamming rates down to zero percent after 2008. The Fed did not lower rates until the end of July, but that decrease was widely anticipated and built into market prices by June - when gold was beginning its precipitous climb.
Interesting.
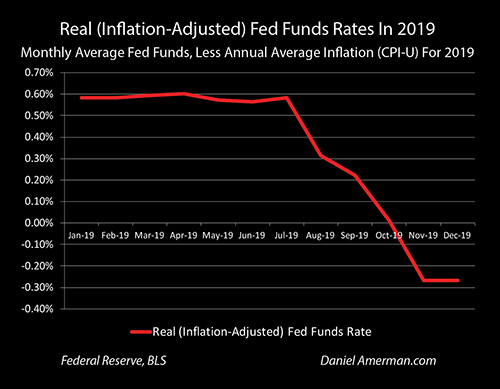
What has not drawn anywhere near enough attention is that in the process of decreasing Fed Funds rates while not changing its inflation target, the Federal Reserve has rapidly returned the United States to negative real (inflation-adjusted) interest rates, with a timing that is not all that different from the steep climb in gold prices.
Interesting.
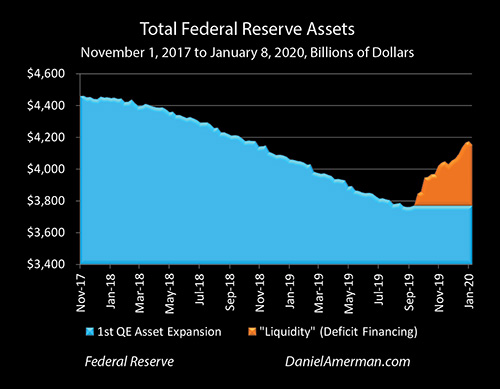
The Federal Reserve attempting to force negative real returns on investors at the same time that the Treasury department was trying sell around $100 billion a month in new debt to investors didn't work out so well. It nearly crashed the systemically important repo market as covered in Chapter 18 (link here), and the Fed had to abruptly reverse course. Indeed, as shown in the orange area above, the Federal Reserve had to rapidly create hundreds of billions of dollars in new money to fund effectively 100% of the growth in the national debt - which is something it never could do before it changed the nature of money in the U.S. in October of 2008.
That fast pivot to abruptly use this new power to create and spend massive sums of money without triggering inflation was the biggest since the aftermath of 2008, and the movement in gold prices unrelated to reported inflation was also the biggest since the aftermath of 2008.
Interesting.
So, the changes in gold prices experienced in 2019 may have little relationship with the rate of inflation that is reported by the Bureau of Labor Statistics. However, there does seem to be a very strong relationship with the Federal Reserve's rapid and extraordinary changes with regard to monetary creation and the degree of its market interventions.
New Factors Driving Gold Prices In A New Decade
This analysis is a brief spin off from my new "Gold Out Of The Box, 2020s Edition" DVD set (brochure link here), as well as part of the ongoing series supporting the new book (sign up link here).
We are at a fascinating place when it comes to both what the Federal Reserve is doing, and what is happening with gold prices. The 2020s are already starting in a very different manner than what we saw through most of the 2010s. The Federal Reserve is currently in trouble, when it comes to its ability to force negative inflation-adjusted interest rates on the nation, while keeping the rapid growth of the national debt fully funded at those artificially low rates.
Gold prices are responding in a very positive manner with regard to these negative developments with the new form of monetary creation that the financial stability of the U.S. as well as elevated stock, retirement account and home prices are all based upon - as it should be. But this isn't just about inflation. Instead what we are seeing is something that is both new, and arguably quite a bit more potentially profitable than what we might see with a purely inflation-based investment.
This is all happening in plain sight - but can be difficult to see when viewed through a purely inflation-based lens. Hopefully this analysis has been helpful to you in seeing gold from quite a different perspective.
********************************************
Free "Turning Inflation Into Wealth" DVD Sets (DVDs only) for the first 15 people to purchase "Gold Out Of The Box, 2020s Edition" at the prepublication price - a total savings of $474.
The free bonus also applies to workshops and other DVD sets priced at $400 or more. These are the original 8 DVDs only, and do not include the manuals or 2010s edition Gold Out Of The Box DVDs (though those are included with the 2020s Edition).
Turning Inflation Into Wealth brochure link.
My newest set of DVDs will be "Gold Out Of The Box, 2020s Edition". Video Chapter One is about the common perspective of gold acting as a stable store of value, and Chapter Two is an uncommon examination of hidden gold taxes. Uncommon approaches for outperforming inflation by enough to come out ahead of those taxes? Those would be among the subjects of video Chapters Three though Twelve of the 2020s edition, as well as the red DVD from the 2010s edition in the right corner. More about the DVDs and the prepublication savings can be found in the brochure, linked here.

Uncommon explorations of how gold can outperform inflation are also the subject of six of the topics and one of the categories of the "Eighteen Solutions In Three Categories" that will be a crucial component of the April two day workshop in Minneapolis (brochure link here).