

A New Great Recession, Once Every Five Years
By Daniel R. Amerman, CFA
TweetWhenever the next recession does arrive, what we know today is that it is unlikely to be a "normal" recession, by the standards of what most people have experienced in their lifetimes.
In this analysis we will compare and contrast the characteristics of an average recession based on 164 years of history, versus what has been experienced in the United States since the end of World War Two. For most of the modern era, we have experienced unusually short and infrequent recessions, specifically because of how Federal Reserve interventions have changed the business cycle.
The issue for investors in general and retirement investors in particular, is that the Fed is trapped inside of a box of its own making, and it appears highly likely to enter the next recession without the necessary tools to exit that recession in the way that most people now take for granted.
What history shows us is that lacking those interventions, recessions become more frequent, average recessions become much longer, and the average investor - and retiree - is likely spend twice as much of their lifetime in recessions.
Indeed, as explored herein, what 164 years of economic history show us is that the so-called "Great Recession" of 2007 to 2009 was not an aberration, but was merely average. If the United States were to return to the long term averages for what recessions have been when the Fed lacks the necessary "ammunition" to quickly exit a recession - then we could expect a new "Great Recession" about once every five years. This then has potentially extraordinary implications for future investment results, as well as financial and retirement planning.
This analysis is part of a series of related analyses, an overview of the rest of the series is linked here.
Prior Analyses
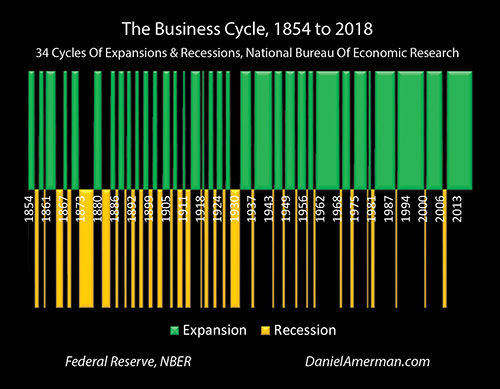
As explored in a previous analysis in this series (linked here), over the last 164 years we have seen 34 cycles of recession and expansion in the United States. This business cycle could be likened to the natural cycle of nighttime and daytime: the sun has gone down 34 times in the form of recessions, and the sun has then come up 34 times in the form of expansions.
However the since the end of World War II we have seen a quite different and visually obvious change in the frequency and duration of recessions versus expansions - the green areas of expansion are "fatter" and of longer duration, the gold areas of recession are thinner and less frequent.
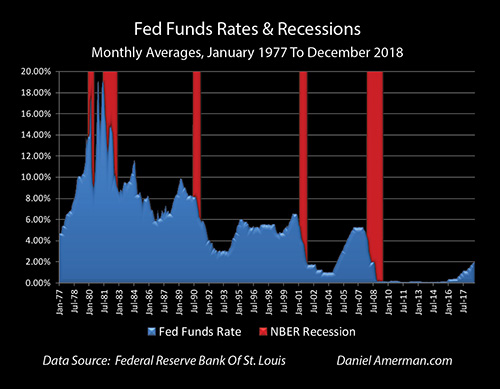
As covered in the prior analysis (linked here) and as can be seen above, the Federal Reserve has been following a monetary policy of responding to recessions in process (or the imminent threat of recessions) by rapid and major reductions in interest rates, and it has been doing this with 100 percent reliability.
This consistency is because smashing down interest rates is the Fed's sole historically proven tool for reducing the length of recessions (or at least the sole major tool). Whenever we enter a recession, the Fed essentially swings a sledgehammer downwards (there is nothing subtle about this process), and by this application of brute force they attempt to jolt the economy out of recession.
As can be seen on the right-hand side of the green and gold graph of the 34 cycles, what we've been getting over the last about 70 years is shorter and less frequent recessions than was the historical norm over the entire period since 1854. Because this material change in the business cycle has been true for most or all of our lifetimes, this has now come to be viewed as the natural recession cycle by people. They believe that this is just the way expansions and recessions work - however, that's not actually the case.
Instead what we have experienced is a change in the natural recession cycle that is highly dependent on the modern Federal Reserve interest-rate cycle. Since the Federal Reserve has adopted these modern monetary policies - with the most important one being the application of brute force through dramatically slashing interest rates - we've seen a major change in the characteristics of the average business cycle.
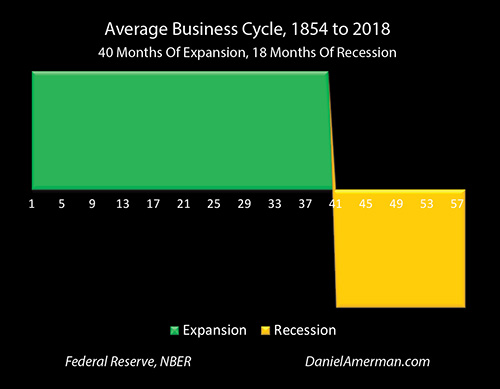
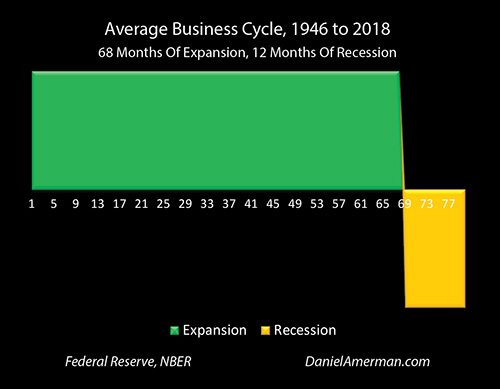
Since 1946 and the advent of modern monetary policies, recessions have on average occurred less frequently: we have moved from the 58 month average business cycle that is shown in the top graph, to the 80 month business cycle that is shown in the bottom graph.
The recessions are shorter, we moved from an average of 18 months to an average recession of 12 months, which is a decrease of 33 percent.
The expansions are longer, we moved from a 40 month average expansion to a 68 month average expansion - which is an increase of 70 percent.
(The above comparisons are based on 1854 to 2018 versus 1946 to 2018. The differences are of course more dramatic if 1854 to 1945 is compared to 1946 to 2018.)
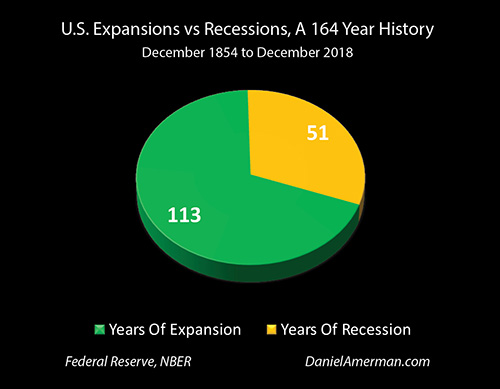
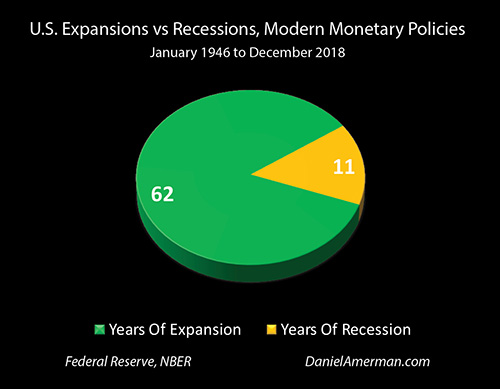
If we compare the relative number of years that are spent in recession versus expansion, then as shown in the two pie charts above, there has been a drastic change. Over the entire 164 years, we could on average expect to spend about 31% of our lives in recessions and the remaining 69% would be in expansions. Since the end of World War II - when the Federal Reserve began its policy of smashing interest rates down by a very large extent every time they believed a recession was either underway or imminent - the time spent in recession is down to about 15 percent, with about 85% of our lives spent in expansions.
Again many people now view this 85/15 ratio as being natural - if that. As covered in the first "night and day" analysis, when it has been a long time since the last recession, many people stop believing in recessions at all, and millions of people can (this happens every time in the modern era) begin taking major financial risks because they have convinced themselves that it will be 100% expansions / 0% recessions from here forwards, and nighttime will never return - the previous 34 sunsets notwithstanding.
Our current issue is that the Fed has not yet exited from its last cycle of the containment of crisis, and the Fed has no historically proven path for hastening the dawn and shortening the recession, if there is a 35th sunset, and a 35th recession. The ammunition just isn't there to create another round of what most people - and most financial plans - take for granted as being the natural order of things.
As explored in the prior analysis the Fed responds to recessions by slashing interest rates - with 100% reliability. The graph below builds on that analysis, but isolates the interest rate reductions from the top - where the Fed "paused" its prior increasing interest rate cycle - to the subsequent Fed Funds rate floor.
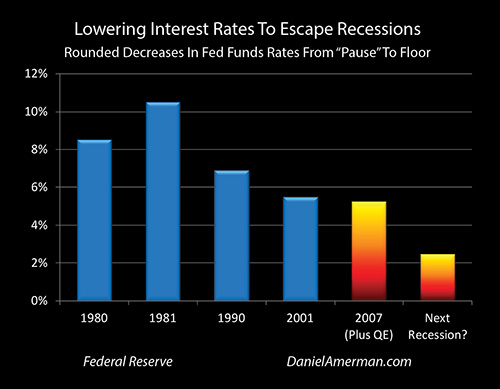
Notice that the interest-rate reduction bar for the 2007 recession is a different color than the blue bars of the total reductions in interest rates used to exit the previous four recessions. The reason for the fire gradient bar is that 2007 was quite different from all the prior reductions.
This because the Fed only had about 5.25% to work with - because of the lower level where Fed Fund rates were the last time the Fed paused - and that meant that even slamming interest rates all the way down to the historically unprecedented level of zero percent interest rates wasn't nearly enough (by itself) to get the United States out of recession the last time around.
Let's look at the historical record for using interest-rate reductions to escape recession, and particularly concentrate on the three blue bars on the left-hand side. The interest-rate reductions averaged over eight percent, if we look at what was needed to jolt the economy out of the recessions of 1980, 1981 and 1990.
As I've written about in other analyses, while the words "monetary policy" may sound quite esoteric, the historical reality is not subtlety but a series of applications of brute force.
The Great Recession of 2007 to 2009 was a particularly nasty recession - it was worse than usual because it was the result of the collapse of an asset bubble. So what the Fed really needed to be able to do was to slam interest rates down by at least the extent that it did in the first three bars on the left side of the graph. The downwards blow likely needed to have been a minimum of seven or eight percent if the Fed's only historically proven tool for getting the US economy out of recession were to work again, by itself.
But there was a problem - the room wasn't there to do that.
In the previous cycle of crisis and containment of crisis, the Fed had already smashed fed funds rates down to fifty-year lows of below 1% in order to quickly exit the previous recession that was the result of the previous asset bubble collapse, with that being tech stock prices.
The Fed never fully recovered from that round of containing crisis from 2001 - and still hasn't. Indeed The Fed effectively backed itself into a box in the 2001 to 2006 period, and understanding that box has critical implications for understanding the much worse dilemma the Fed, the economy and the investment markets face today.
As explored in the analysis linked here, by forcing interest rates to 50 years lows, the Fed created an unnatural spike upwards in asset prices, particularly real estate prices. The Fed then went through a cycle of increasing interest rates, but it had to prematurely pause its cycle of increasing interest rates in 2006, during a time of yield curve inversion and growing fears about future economic growth (with many similarities to today).
The problem was that interest rates had started at 50 year lows, and even raising Fed Funds rates to a total of 5.25% before the pause, was not nearly enough to get the room to rates to a level of at 7% to 8%, where history showed that just slamming down interest rates by itself would be enough to exit recession.
So, trapped in a box of its own making, with the lowest interest rates in 50 years having created an asset bubble, but without the room to raise rates to the level needed to exit recession, when the recession did arrive and it was exacerbated by the popping of the asset bubble - the Federal Reserve had to go to someplace entirely different and resort to extraordinary new "unconventional monetary policy" measures including quantitative easing, i.e. dropping all pretenses about what modern money really is, and creating trillions of dollars in new money out of the nothingness.
It initially used those dollars to prop up the banking industry and save the global financial system from the bank run then in process. The new money was supposed to be very temporary, but keeping it and expanding it was too tempting, so the Fed then took the unprecedented step of buying long-term mortgage-backed securities in amounts roughly equal to total new mortgage originations at very low interest rates, and to thereby help bring the U.S. economy out of recession by rescuing the housing industry.
The Fed then created still more money, to invest in medium and long term Treasury bonds while helping to (indirectly) finance the federal deficits, as the government used stimulus spending to try to lift the economy out of recession. This also allowed the Fed to exert an unprecedented degree of control over medium and long term interest rates, forcing them down as well, in another form of economic stimulation.
By going to zero percent interest rates, which was unprecedented, and using quantitative easing to directly intervene in the economy in a number of other ways - which were also unprecedented - the nation just barely eventually emerged from recession. In the process, those extraordinary interventions also changed every aspect of investment prices and returns - and financial planning - relative to what we've seen in previous decades.
That above may sound like a bit of an economy history lesson at this point - but it isn't, instead that discussion was even more about our collective future. To see why, let's take another look at our graph.
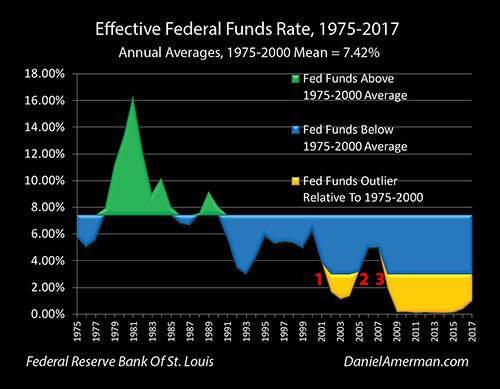
As can be seen, the Fed is in a similar but much worse predicament to where it was before the recession of 2007. Interest rates are far lower than they were at that time and the Fed has tried to raise them (again) - but it is looking increasingly like that the Fed will be pausing in 2019, again, as it did in 2006, which was also the last year that the yield curve inverted (a current 2 year to 10 year inversion has not yet occurred, and might not, but we remain very close).
The Fed is likely pausing because of worries that raising rates further will set off asset bubble collapses and trigger another recession - which is also the same situation as last time.
However, the current target Fed funds rates range is only 2.25% to 2.50% - which is a complete outlier relative to the situation coming into previous recessions. Current interest rate levels are less than half of what they were in 2006 and 2007 - and as reviewed, those rates were too low to allow an interest rate reduction of sufficient magnitude to exit recession by itself, additional measures funded by quantitative easing were needed in order to exit that particularly long and painful recession.
If we look back to the four interest reductions over the last four decades that were enough by themselves to be "successful" and jolt the economy out of recession - those averaged about 7.8%. The distance from current levels to zero percent is only about a third of that amount.
So even as the warning signals flash that another cycle of recession could occur in the next 1-2 years, history shows us that the Fed has put itself in a much worse "box" than it was in the last time around, with only has about 1/3 of the "power" needed to exit recession in the way and within the time period that most investors take for granted these days.
The Price Of The Pause
The Fed apparently "pausing" the interest rate cycle is currently very popular with the stock market, and the real estate market loves it as well. However, this "pause" comes with a potentially very high price. If the cycle over the last 164 years is continued, and there is 35th iteration of recession, then the Fed will be almost helpless when it comes to its only proven historical tool for hastening the beginning of the next and 35th cycle of expansion.
This could put us back on the left side of the graph with more frequent and more severe recessions and shorter recoveries than what we have seen in the post World War II era. It is also worth carefully studying the graph repeated above, and comparing the Great Recession to the other yellow bars on the left and right side of the graph.
For the first time since World War II, the Fed was unable to entirely rely on its primary tool for shortening recessions when it ran out of room at zero percent interest rates, otherwise known as the ELB or Effective Lower Boundary. Relative to the right side of the graph - this produced the "Great Recession", a somewhat fatter yellow bar that was the worst downturn since the Great Depression. However, relative to the left side of the graph - the so-called Great Recession was nothing special, it fit right into the long string of fatter yellow bars that are the normal historic range when we don't have a Fed using its one proven tool for shortening recessions.
This is critical because many commentators today treat the 19 month Great Recession of December of 2007 to June of 2009 as being a complete aberration, a bizarre outlier that never should have happened in the first place, and will never happen again.
That perspective is simply not factually accurate. Look at the width of the golden bars on the left side of the graph - based upon 164 years of history as studied by the National Bureau of Economic Research, an 18 month recession is exactly average. Recessions of about the length of the Great Recession are in fact the long term norm - unless the Fed is actively intervening, which it now lacks the room to do in the historically proven manner.
The other key fact to keep in mind is that over 164 years, the average length for each business cycle of expansion and recession was 58 months. So, if the United States were to actually return to long term averages for recessions and expansions, there would be the equivalent of another "Great Recession" about once every five years.
This would also put us right back into being prepared for almost a third of our lives (or our retirements) being spent in recessions - which is the average over the last 164 years. Unfortunately, most financial planning is at least implicitly based upon short and mild recessions about 15 percent of the total time (or the total retirement).
When we look at buy and hold strategies, and effectively ignoring the recessions because they are brief and mild relative to the expansions - this is assumed as being the natural order of things, because it held true during the entire period during which modern portfolio theory and modern financial planning were developed.
The Fed having the room to slam interest rates down and contain recessions purely with the reduction of interest rates is implicitly built into every conventional financial plan - even if relatively few retirement investors are aware of this.
But that room is simply not there anymore.
The Fed was in this box before in 2006, and the results included the Great Recession and the introduction of quantitative easing, creating dollars out of the nothingness by the trillions because the Fed saw no alternative. With interest rates now far lower, but the markets threatening to melt down if there are substantial future interest rate increases, the Fed remains in the box of its own making that it has been in since 2001, trapped inside cycles of crisis and the containment of crisis, but with even fewer conventional or proven options than before for escaping that box.
Seeing The Cycles & The Change In The Cycles
Reading the above, some people might jump ahead and think the conclusion is gloom, doom and catastrophe! As in either we make sunny assumptions about the future - or we go straight to the collapse of the financial system.
The problem with those two popular perspectives is that we have 164 years of history, and what those years show us - is that both perspectives are dead wrong.
The sun will almost certainly set again, and as covered in the first analysis in this series, this happens quickly and with great regularity. The average time from the midpoint of each expansion to the onset of each recession is only 20 months.
The sun will also almost certainly rise again, and what history shows us is that the average time between the darkest depths of the middle of each recession, and the next sunrise with the onset of the next expansion - is about 9 months.
All else being equal - with the Fed's primary tool for containing recessions no longer being fully available to it, we should expect a return to what history shows us is a more normal business cycle.
As explored herein, it would be a faster cycle, averaging a new recession every 58 months instead of every 80 months. The recessions would average 18 months each instead of 12 months, an increase of 50% (with some depressions thrown in as well).
It would not be the end of the world, nor would there need to be a monetary collapse (although history shows those happen every now and then as well). However, the more frequent recessions and longer recessions would combine to mean that the average person should expect to spend about a historically normal third of their life - and a third of their retirement - in recession, instead of the 15% that most people now (implicitly) take for granted as being the natural order.
There is an alternative to a return to the historic norm in terms of longer and more frequent recessions, and that is that the Fed could contain a 35th recession with even more aggressive and unconventional measures that what we have seen to date.
These interventions that could dwarf what we saw the last time around in terms of quantitative easing and zero interest rate policies. This could be true in both in their power and in their impact on prices and returns in almost all investment categories.
The 35th cycle of recession and the 35th cycle of expansion are each likely to be quite different from what we have seen in past decades. So long as the night and day cycles which we have experienced over the last 164 years continue, then the future will hold a recession - and we know right now that we simply don't have the usual tools to contain and shorten it, we lack the tools which we have all come to take for granted in recent decades.
One alternative then is that next recession could be much deeper or longer than recent recessions. It could be more like the long term historic average. Indeed, the Great Recession (which was just an average recession from a long term perspective) could have been much deeper or longer if the last round of extraordinary measures, those of zero interest policies and quantitative easing, had not been used to contain it.
Many people may view this is being pessimistic - but this doesn't mean that there won't be another sunrise or another day. As we have seen with the previous 34 cycles, if there's one thing that history shows us, it is that coming sunrise - the next expansion - is every bit as reliable as the next recession.
However, to get to that place - to get to that next expansion - the path needs to be different than what we have been seeing since the end of World War II. The last two rounds of the containment of crisis have been very different and they have completely transformed the investment world in the process.
So as covered in the prior analysis, if there's another recession, then as a starting point we would likely go straight back to zero percent interest rates - which could change everything in the markets. We would go straight back to the very abnormal place where very little of our prior investment history from 1946 to 2000 applies but this time that won't be nearly enough.
In the process it will impact every single investment category as shown in the framework below, which I have been using to discuss the investment implications (the rows) of the changes in the cycles of crisis and the containment of crisis (the columns).
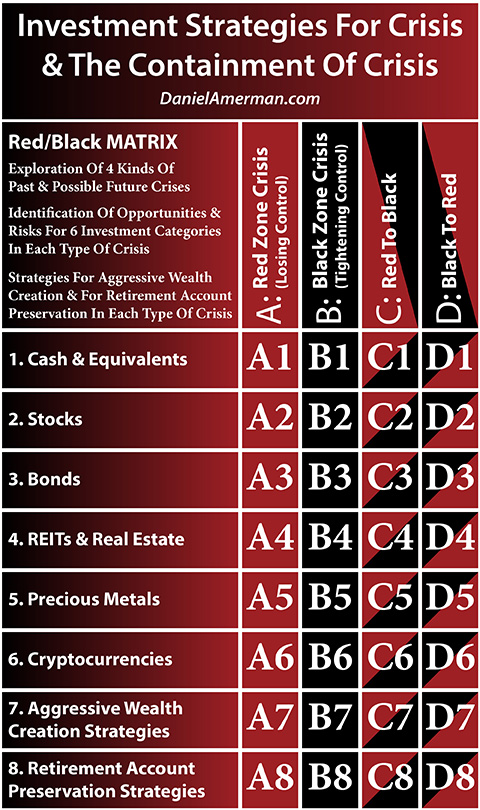
An explanatory analysis for the matrix is linked here.
The specifics of the next iterations of how night follows day, and then day follows night, are likely to make the biggest changes to the investment world that we have seen in our lifetimes. And yes, there are likely to be amplified losses as part of this next 35th cycle of recession, particularly when it comes to traditional strategies that essentially assume the 1946 to 2000 era will endlessly repeat itself.
However, we are also likely to see some of the greatest profits in history, when it comes to the investment categories that can not only survive but prosper with the nightfall. And then in the next turn of the cycle, the amplified profits are likely to move to the generally quite different investment categories that will thrive with the eventual new sunrise and the new expansion.
*******************************