


Is Gold "Perfect Money" - Or An Investment Driven By Supply & Demand? (Stage Three Analysis)
By Daniel R. Amerman, CFA
TweetIn this analysis we will test a theory about gold in modern markets, which is that the real value of gold is not stable, but is tightly linked to the rate of inflation.
The idea is that when inflation is higher - then real (inflation-adjusted) gold prices should be higher, as a higher percentage of the population should be trying to protect themselves, and bidding up the price for gold. In other words, the laws of supply and demand within an investment market mean that there is an increasing demand for a limited supply of gold, and that should be driving up real prices, as buyers outnumber sellers.
Conversely, when inflation is low - then real gold prices should be lower as well. Fewer people are worried about inflation, this decreases demand, an imbalance of investors is created as many exit the market while selling to a shrinking group of remaining gold investors, and prices should fall in real terms.
It should be noted that this is a very different perspective from what many people believe about gold, which is that it acts as "perfect money", meaning that it is a stable store of value which always maintains its purchasing power. From that perspective, gold investors are protected from inflation by definition (absent outside manipulations).
The issue is that both perspectives can't be true simultaneously - no matter how badly some people want it to be so. (This same conflict between "stable store of value" and "big investment gains/losses" exists for cryptocurrencies such as Bitcoin as well.)
To find our answer we will examine historical inflation rates and real gold using numbers, visual comparisons and statistics. The results are both remarkable and conclusive for the years studied. Indeed, they have the capability to change how even long-time gold investors think about gold.
This is the third analysis in a series. In the first analysis (linked here), we looked at a 40 year history of gold prices in "nominal" terms (not adjusting for inflation) and compared it to the consumer price index in each year. We found that there was indeed a 73% correlation, meaning that 73% of the changes in gold prices could be explained by changes in the consumer price index. But yet, we also found that the 27% that was not correlated seemed to be of crucial importance, as there were long periods of time where nominal gold prices fell even as inflation was steadily decreasing the value of the dollar.
In our second analysis (linked here), we raised our level of sophistication, and split out two types of inflation and deflation: price inflation and deflation, and asset value inflation and deflation. We then used those tools to take a fresh look at the last 40 years - and found a very different history for gold, where price inflation was distorting and covering over the changes in purchasing power for gold. This type of methodology also has crucial implications for stock prices, and for those who may be concerned about high current values for stocks and other investments potentially creating future deflation.
This analysis builds on the first two analyses, and it is highly recommended that they be read in order.
Real Gold Prices, Annual Rates Of Inflation & Deviations From The Mean
There are three critical components to the tables and graphs below. The first is that we are moving from the Consumer Price Index (CPI), to annual rates of inflation.
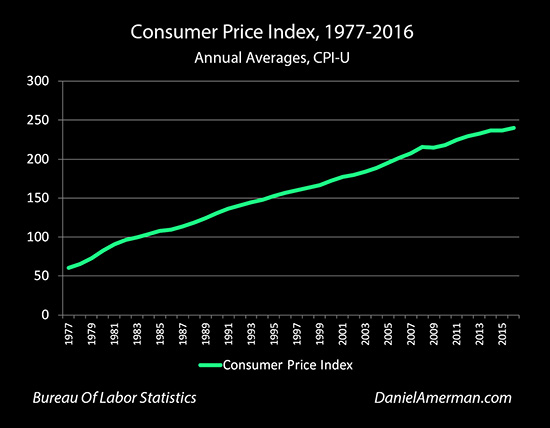
The CPI does show what matters over time, which is the steadily increasing cost of paying for an average lifestyle, meaning a steadily decreasing purchasing power for the dollar (as a matter of Federal Reserve policy). It is, however, difficult to pick out the annual variations in this long term process.
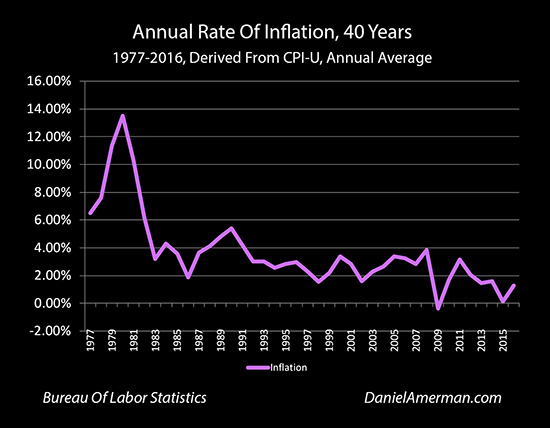
When we move to annual rates of inflation, it becomes much easier to pick out changes in individual years. Crucially, the overall trend line also changes. Yes, inflation does steadily increase prices over the years, as shown in the ascending CPI line. But the rate at which inflation increases prices has been decreasing over the decades (at least, according to the government).
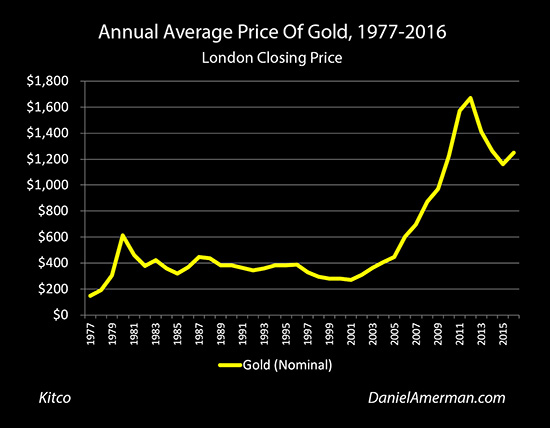
The second component is moving from nominal to real gold prices. The above graph shows the annual price of gold in simple (nominal) terms, and there is a strong upward trend, as covered in the first analysis.
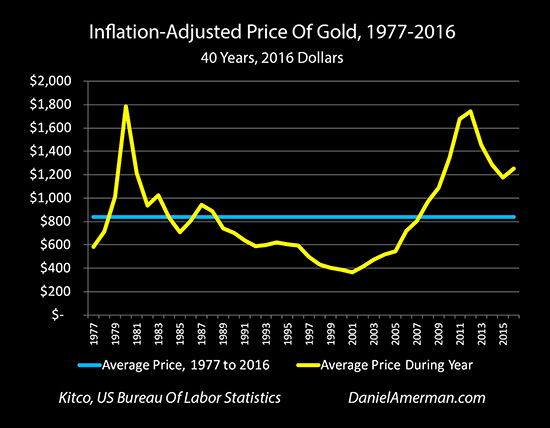
This picture entirely changes when we focus on historical gold prices in inflation-adjusted (real) terms, as covered in the second analysis, where removing the illusion created by inflation creates two spikes and a trough, rather than a steady upward trend.
The third analysis component is to bring inflation rates and real gold prices into common terms for easy comparison, and one way of doing this is to measure historical movements as deviations from the mean (which is just a fancy way of saying changes from average).
The average rate of inflation from 1977 to 2016 was 3.70%. The average real (inflation-adjusted) price of gold over that time was $852 in 2016 dollars.
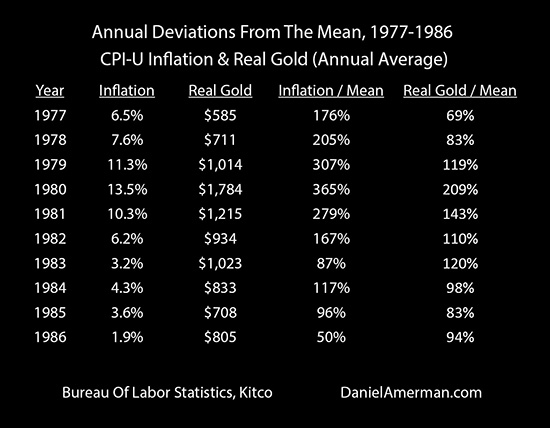
As can be seen above, in 1977 the average annual rate of inflation was 6.5%. This is equal to 176% of the long-term average inflation rate of 3.70%. That same year, the real price of gold in 2016 dollars was $585 per ounce. When we divide $585 into $852, we find that gold prices were equal to 69% of their long-term average.
So our starting point in 1977 was a rate of inflation that was far above our 40 year average, and real gold prices that were well below average.
As can be seen in the preceding tables, the average annual rates of inflation and average annual real gold prices bounced up and down over the years, but are hard to directly compare because of the different scales. By comparing each to their mean in percentage terms, the relative degree of change in each year can be readily seen.
A Visual Comparison
This also allows direct visual comparison, which makes the relationships much more intuitively obvious.
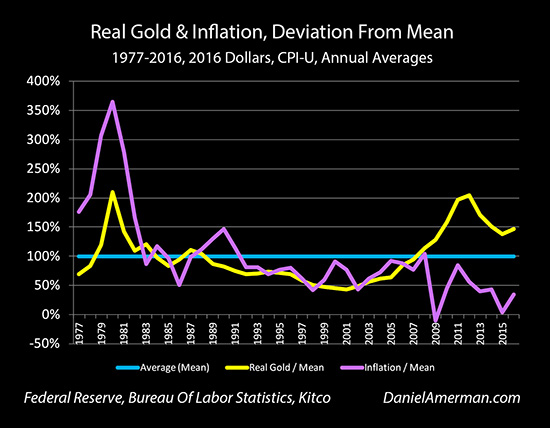
The six years from 1977 to 1982 look like a powerful confirmation of the view that gold is an investment that rises and falls in value with the rate of inflation. There was an inflationary spike up to 13.5% in 1980 (annual average rate), which was 365% of the long-term average. Real gold prices tracked it almost perfectly, peaking in the same year of 1980 at $1,784 an ounce in 2016 dollars, or over 200% of average.
When inflation fell, forming the other side of the spike - gold fell right with it. Exactly the way we would expect it to, if real gold prices are correlated with inflation. As inflation fell from 365% to 167% of the mean, real gold fell from 209% to 110%.
Now, this time period of 1980 to 1982 is very problematic for the belief that gold acts as "perfect money", exactly maintaining its value in inflation-adjusted terms. Even while rates of inflation were at some of their highs for the modern era, gold was getting crushed and falling from $1,784 to $934 an ounce, for an almost 50% loss in two years in purchasing power terms.
But when we move from "perfect money" to supply and demand in an investment market - this is just what we expect. Everyone piles in and buys gold as inflation spikes upwards, and demand exceeds supply. When inflation rapidly falls, much of the market abandons their inflationary hedges, and prices fall fast as sellers outnumber buyers.
The relationship is not perfect over one year holding periods, as we can see in 1983 and 1984. Inflation plummets in 1983, falling from 167% of the average all the way down to 87%. Gold should be hammered - but it instead rises from 110% to 120% of the mean. And then in 1984 inflation spikes upwards to 117% - and gold prices fall to 98% of average.
But, while not perfect, the lines are still in the same vicinity on the graph.
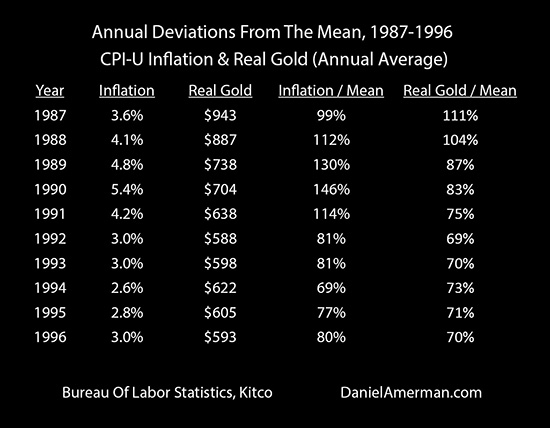
When we look at 1992 to 1998, it isn't just that the slopes of the lines are similar, but they are almost on top of each other. Year after year, inflation and real gold prices are moving in almost perfect synch not only with each other, but also in almost identical percentage terms compared to their long-term averages. Looking at the tables, for seven years the two factors remain within 4-14% of each other, as percentages of their respective means. That seems completely incompatible with uncorrelated randomness, and the statistical odds against seeing that pattern in multi-year periods are significant.
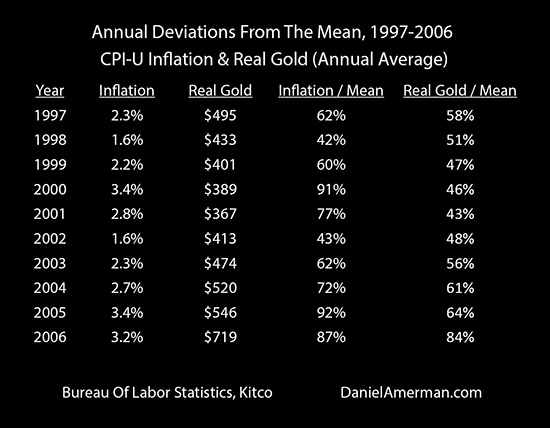
And then we get another inflationary spike peaking in the year 2000 - which should be driving gold prices higher as buyers outnumber sellers. But instead, even as inflation is rising - real gold prices just keep falling, reaching their modern low in 2001 at 43% of average. The relationship is not perfect, but again, it is plainly obvious that the two lines remain in the same ballpark, so to speak.
Then there is a second seven year period, that of 2002 to 2008, where it isn't just that the slopes of the lines are similar, but they are almost on top of each other. It is not quite as tight as the 1992 to 1998 period, because of a single 28% divergence in 2005, but all the other years are within 3-18% of each other. Year after year, inflation and real gold prices are moving in almost perfect synch not only with each other, but in also in almost identical percentage terms compared to their long-term averages. With uncorrelated randomness, the statistical odds against seeing that pattern in not just one but two separate seven year periods are high.
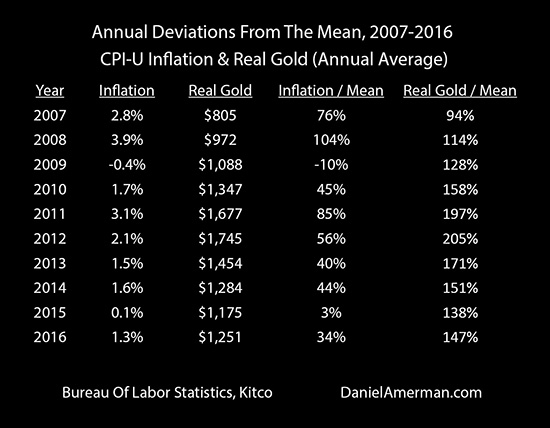
Indeed, if we isolate our analysis to the years 1977 to 2008 - leaving out the financial crisis and post-crisis years - then the degree of visual correlation is quite high.
When we measure those years mathematically - the correlation between the average annual rate of inflation and the average annual real (inflation-adjusted) gold price is 77%. That is very good.
And interestingly, if we look back to our measure of CPI and gold prices in nominal terms, the correlation between 1977 and 2008 falls to only 42%.
The "800 Pound Gorilla" In The Room
I do appreciate the letters I received from long-time gold investors after I published the first analysis in this series, where it was explained to me that false government inflation rates and manipulated gold markets in the wake of the 2008 crisis were responsible for the less than perfect correlation between gold and inflation.
Those letters missed the point. Historically, there is an "800 pound gorilla" in the room when it comes to the "gold as perfect money" belief system, and it has nothing to do with the financial crisis of 2008 or the years thereafter.
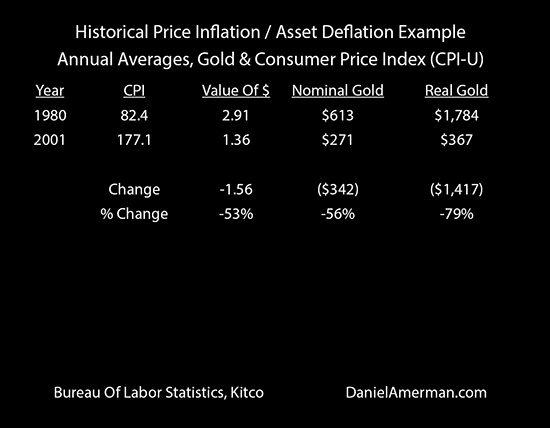
The "gorilla" can be found in the years 1980 to 2001. This is 22 out of the 32 years (from 1977 to 2008), and during that time the purchasing power of the dollar fell by 53%, from $2.91 (compared to 2016 dollars) down to $1.36. Gold was supposed to double in value from $613 to over $1,200 an ounce - if gold were acting as perfect money - but it instead fell by over 50% in nominal terms, declining to $271 an ounce. And if we look at what really matters, which is what the gold would purchase for us, then the loss was a far greater 79% of purchasing power.
Some might argue that it is unfair to "cherry pick" the period between the peak of the spike and the depths of the trough - but the moment that objection is raised, the argument for "gold as perfect money" is lost. Perfect inflation hedges aren't supposed to have peaks and troughs, they are supposed to do a really good job of maintaining value, particularly over the long term.
Now, if we just very slightly change our paradigm from "perfect inflation hedge" to "inflation hedge investment" - then peaks and troughs are not only allowed but are very much expected.
If we say that supply and demand drive real gold prices, then an inflationary spike peaking in 1980 would be absolutely expected to create a flood of gold buyers who would drive gold prices to a corresponding spike. Which is what happened.
When the inflation rate fell rapidly over the following several years, this should have led to a drastic decrease in demand as a flood of former buyers turned into a flood of motivated sellers and real prices should have plunged. Which is what happened.
And as the inflationary spike of the late 1970s and early 1980s was slowly forgotten, and average rates of inflation slowly slid downwards, the public demand for inflation hedges should have steadily decreased over time, as ever more investors gave up (or passed away) and exited the market, while not being completely replaced by younger new investors, leading to ever falling real gold prices over the decades. Which is what happened.
Mapping The Divergences
Perhaps the most compelling evidence for gold being an inflation hedge investment whose value varies with the rate of inflation, rather than acting as "perfect money", can be seen by visually comparing the divergence between what was expected and what was.
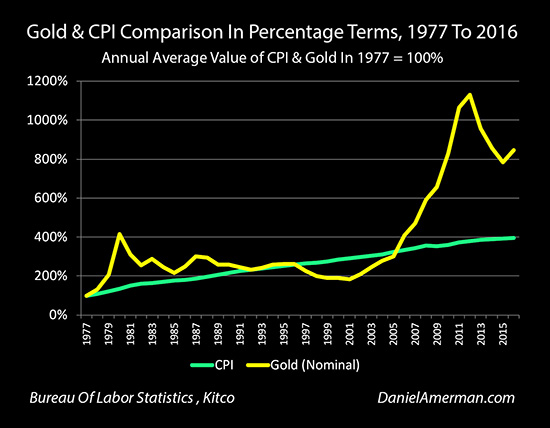
If nominal gold exactly tracked with inflation as measured by the Consumer Price Index, then there should be no divergence between the two. But there is a substantial divergence as shown in the graph above from the first analysis.
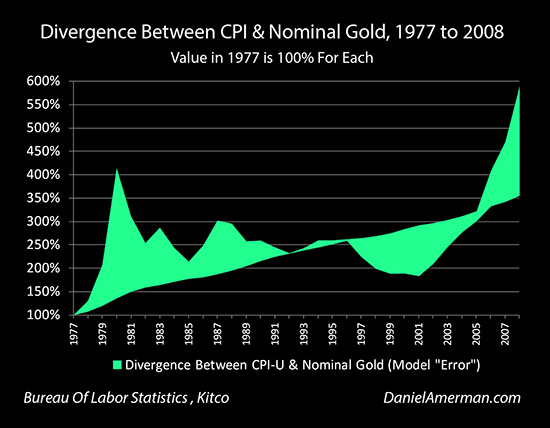
When we replace the lines with the area between lines we get the graph above. The graph above shows the surface area of the divergence between the two lines between 1977 and 2008, and it is overwhelming. Another way of looking at this is if gold had perfectly tracked the CPI - there would be no green. Wherever we see green, it is an error in the model / theory that gold acts as "perfect money" and functions as a perfect inflation hedge. (The period captured ends in the year 2008, for reasons that will be developed.)
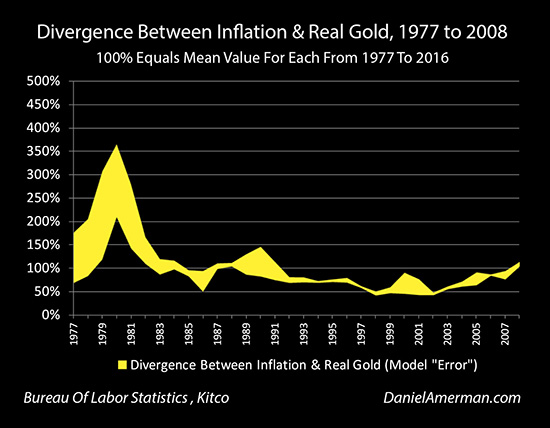
The next graph examines inflation and real gold between 1977 and 2008. If the real price of gold were 100% correlated with the annual rate of inflation, then there should be no divergence. The graph in this case shows the divergence - and wherever there is yellow is a model / theory error. While the relationship is not perfect, the amount of yellow surface area (the errors) is a fraction of what we saw with nominal gold and the CPI. (Both graphs have a 500% difference between top and bottom, to maintain visual comparability.)
The difference between the green and yellow shapes is also worthy of close study. With the green shape, there is a vast, broad divergence between the CPI and nominal gold prices (as percentages of their starting values), where they move entirely different directions for many years at a time. With the yellow shape on the other hand, while there is some zigging and zagging, the shapes of the lines for annual inflation and real gold prices are very similar, and are in fact amazingly close to each other in a number of years. Even where the yellow surface area is greatest in the early years - the two factors are still moving up and down together.
We also have to keep in mind what is being measured. With the first graph (the green surface area), we are looking at a not particularly accurate way to predict what is an illusion - the nominal purchasing power of gold. As covered in detail in the second analysis, this can be highly misleading. Whether an individual gold purchaser understands the difference between price inflation and gold asset value inflation doesn't really matter when it comes to outcomes. They believe they are preserving purchasing power, and it is only by measuring inflation-adjusted purchasing power that success or failure can be determined.
What is fascinating about the second graph (the yellow surface area), that of the divergence between inflation and real gold prices, is that there is a double dominance relative to the first graph. What is evaluated is far more important - which is the actual purchasing power of gold. And the correlation between the two factors is far greater. So we have a much more accurate method of understanding what it is that actually matters most to gold investors.
A Surprising & Convincing Result
There were still some spikes with the annual averages, so I used a statistical smoothing technique and calculated 3 year rolling weighted averages for inflation and real gold prices, to see if some of the variation dropped away with longer holding periods.
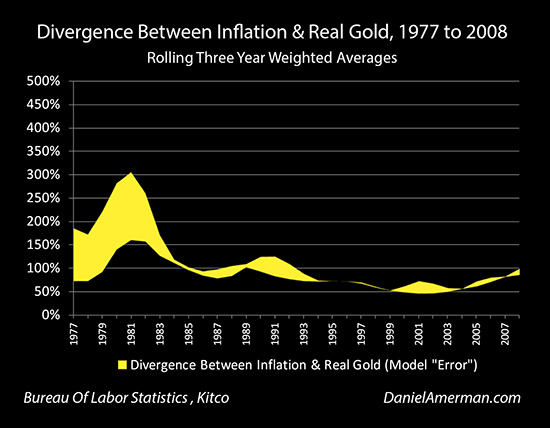
The results are shown above - and they are stunning. Speaking as a professional financial analyst with over 30 years of experience - to be using decades of real world data, and see the model "error" repeatedly either disappear altogether or become very "wispy", is amazing. That is not at all how things generally look when comparing two data series even when there is strong degree of correlation.
Often with shorter term holding periods there is more statistical "noise". It can be very difficult to trade fundamental value relationships on a daily, weekly or monthly basis.
With a three year rolling average, each year represents the average of that year and the preceding two years. So what is shown as 1977 is the average of 1975, 1976 and 1977, what is shown as 1996 is the average of 1994-1996, and so forth.
During the time period between 1974 and 2008 (and particularly between 1983 and 2008), for long-term investors who were investing for three years at a time - the value of their gold investment had a high correlation with the rate of inflation experienced. (1974 was the first year of the first 3 year average, 2008 was the last year of the last 3 year average.)
Three year average real gold prices moved up and down in a surprisingly tight relationship with three year average rates of inflation. This is consistent with gold acting as an investment whose price rises and falls with the relative numbers of buyers and sellers, and with inflation and fears of inflation being the most important determinant of the numbers of buyers and sellers.
For someone who was attempting to maintain the inflation-adjusted value of their savings over the long term, then this principle had to be understood - and it had remarkable explanatory power.
That was true through 2008, anyway. And then things fell apart.
Something happened in the post-crisis era that seemed to radically change the relationship between the annual rate of inflation and real prices for gold. We will go in search of what changed - and what additional factors we should be taking into consideration - in the analysis that follows.
(This series of analyses is a work in progress. Please check back for updates, or sign up for the free book to be notified when Stage Four analysis comes out.)
 What you have just read is an "eye-opener" about one aspect of the often hidden redistributions of wealth that go on all around us, every day.
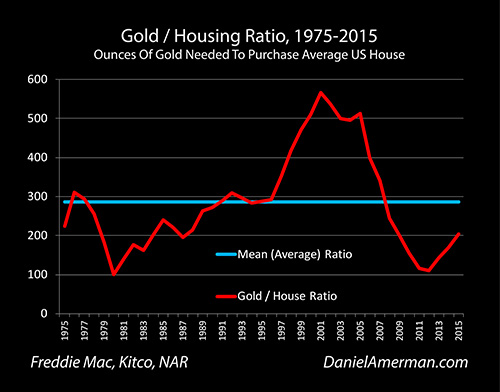
Over the last forty years, the Gold/Housing ratio has been a quite useful measure for evaluating relative values between real estate and gold. As explored in the analysis linked here, this ratio also has an interesting historical track record for identifying turning points in long-term gold price trends.
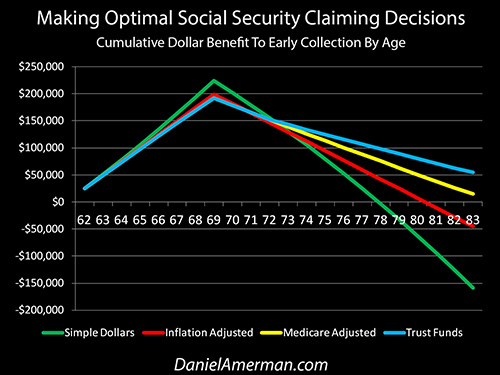
How tax rates are presented to the public can be quite different from how they really work – and the same is true of Social Security. The government strongly encourages people to wait as long as possible before collecting their retirement benefits – but as explored here, is that truly in your best interest, or are a few factors being left out?
National debts have been reduced many times in many nations ─ and each time the lives of the citizens have changed. The "eye-opener" linked here reviews four traditional methods that can each change your daily life, and explores how governments use your personal savings to pay down their debts in a manner which is invisible to almost all voters.


If you find these "eye-openers" to be interesting and useful, there is an entire free book of them available here, including many that are only in the book. The advantage to the book is that the tutorials can build on each other, so that in combination we can find ways of defending ourselves, and even learn how to position ourselves to benefit from the hidden redistributions of wealth.