


Gold, Inflation & The Missing 27% (Stage One Analysis)
By Daniel R. Amerman, CFA
Tweet
Why do people buy gold?
I think most gold investors and the average person would say that the purpose of buying gold is to protect against inflation. Which brings up the question of how well does that work?
In this financial analysis we will use 40 years of historical data to see how that has actually worked in practice - which can be an entirely different thing than opinions and commentary about how gold works.
In the process, in this first of a series of analyses, we will identify two common myths about gold that many people believe which simply aren't true. Once we've done that, we will come back in later analyses, use some more sophisticated forms of financial analysis and find some other factors that just might be better predictors for how gold prices actually work than these common myths. There could be some crucial implications there for someone who is either investing in gold or thinking about investing in gold.
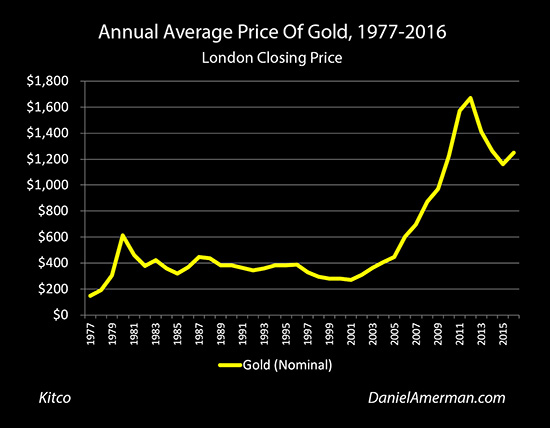
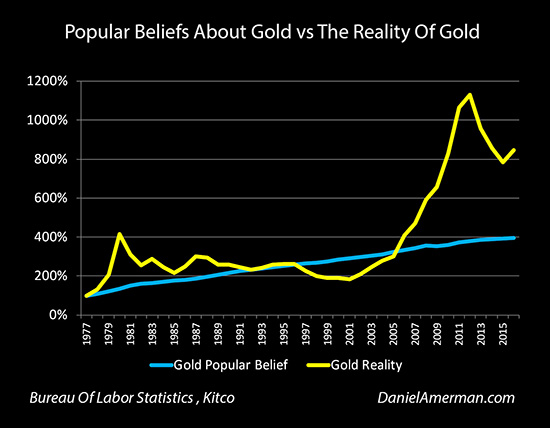
Let's start by taking a look visually at gold over the last 40 years. This is the time period from 1977 to 2016 and we're looking at the annual average price of gold. If we start in 1977 that was under $200 an ounce, if we go all the way out to 2016 it's up to over $1,200 an ounce, so it has clearly climbed over time
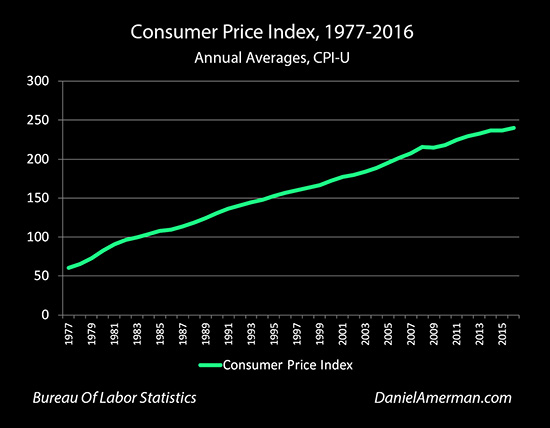
Now let's take a look at the consumer price index, or in this case the CPI-U, where 100 is the purchasing power of the dollar on average in the years between 1982 to 1984.
What the consumer price index looks at is the amount of money that it takes for the average person to purchase a lifestyle in terms of goods and services. So the more money it costs to buy those things, the higher the CPI, and the less the dollar will buy. It's a form of inflation measurement.
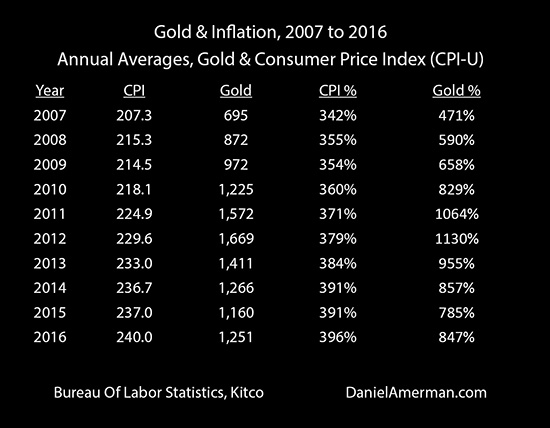
If we look at the consumer price index, it went from a little over 60 in 1977 up to about 240 by 2016. So the consumer price index has also climbed relatively sharply over those 40 years.
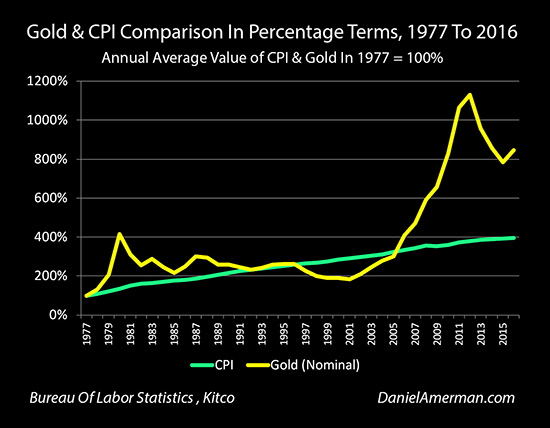
If we put them both in percentage terms, with where they started in 1977 as being 100 percent, we can then put the two on the same graph. When we do this, we can see that what's going on here is that they are both trending upwards over time.
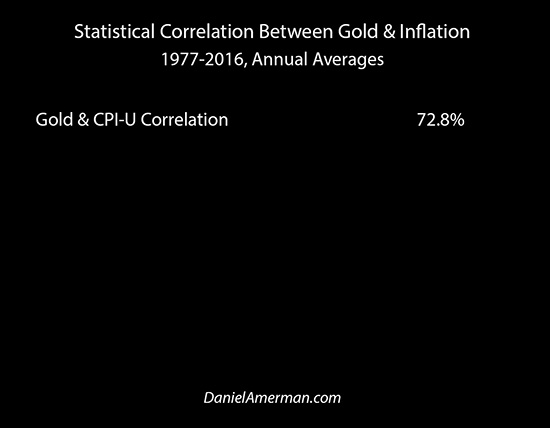
When we measure this mathematically what we come up with is that 73 percent of the change in gold prices can be explained by the changes in the consumer price index. In other words, inflation accounts for 73 percent of the price movements in gold, which means that it looks like a pretty good hedge.
But there is a bit of an issue and that is the other 27 percent, and when we come back to our graph this seems visually obvious. We have this big spike upwards with gold around 1980 that we just don't see any sign of the CPI. We then have gold declining for many years as the CPI is increasing - and that doesn't seem right.
We have this enormous spike upwards in gold starting in the early 2000s that we don't see any sign of in that CPI line. And we have a plunge downwards in gold after 2012, and a little bit of rebound in 2016, where again - we just don't see that anywhere in the CPI.
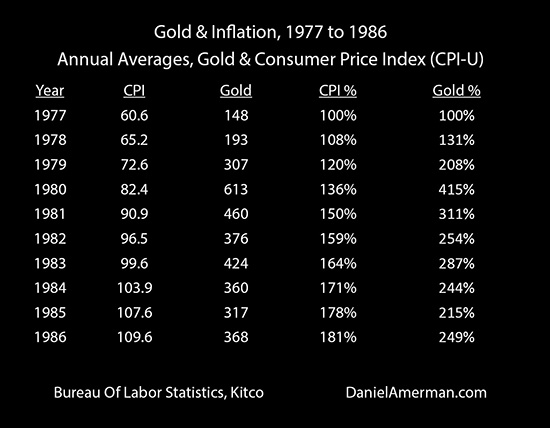
So let's use the actual numbers to take a much more specific look at what's going on. If we look at the period from 1977 to 1980, the CPI went from 60.6 to 82.4, which is an increase from 100 percent to 136 percent.
In that same time frame - gold did something simply amazing. It went from $148 an ounce to $613 an ounce, and that took gold up to 415 percent of where it started at. This was a wonderful thing if you were a gold investor at the time - but the correlation doesn't seem that strong with what was happening with the purchasing power of money.
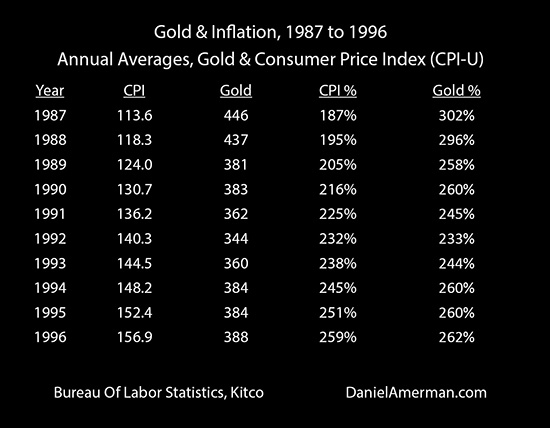
Now let's take a look at the period from 1980 to 1996. We started off with a CPI of 82.4 in 1980, and by the time we get to 1996 it is 156.9. Looking at it in percentage terms, we've gone from 136% up to 259%, so we haven't quite doubled over that time period.
At the same time gold went from $613 an ounce in 1980 down to $388 an ounce in 1996. So it went from 415% of where it started at down to 262%.
So the dollar lost a tremendous amount of purchasing power - which gold was supposed to make up for by increasing in price. But in fact, just the opposite happened, and gold lost most of its value during a time when the dollar was losing almost half of its value.
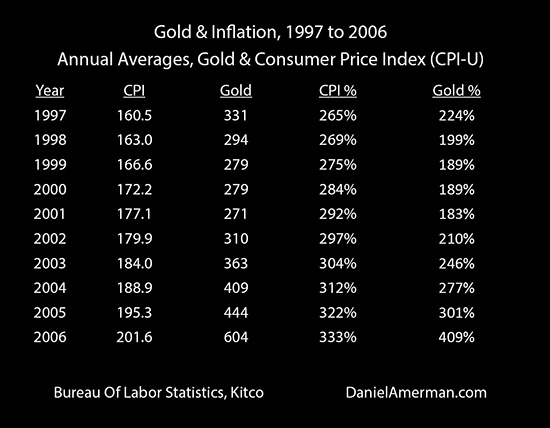
Now let's take a look at the time period from 1996 to 2001. The CPI went from 156 to 177, an increase from 259 percent to 292 percent. At the same time, gold went from $388 an ounce down to $271 an ounce.
So again there was inflation - not as much as we saw before but still quite a bit - yet the price of gold just kept falling. That's not at all what it was supposed to do.
Now let's take a look from 2001 to 2012. The CPI started at 177 and it increased to 229. Putting it on a common percentage measurement to be able to better compare with gold, it moved from 292 percent to 379 percent - that's significant.
Gold went from $271 an ounce up to $1,669, which was the average price for gold over the course of the year 2012. That was up to 1130%.
When we look at this graphically we can see this just tremendous change that occurred there that made a lot of gold investors very happy over those years, but it just doesn't seem to have any relationship with what was going on with inflation in terms of the consumer price index.
Then we look at period from 2012 to 2015. We continue to have inflation, the CPI went from 229 to 237, so it's a much lower rate of inflation - but prices are still increasing. Gold should still be increasing in value to keep up with that. Instead we had a plunge from an average of $1,669 to buy an ounce to $1,160, which is a decline from 1130% down to 785%. How do we explain that using inflation?
There's a very clear issue whether we look at this graphically or using the actual numbers. Yes, the two do trend together over time, when we look at the directions of the yellow and green lines, and over a 40 year period one can indeed explain 73 percent of the change in gold prices by the changes in the purchasing power of the dollar.
But, the specifics are very different when we see that yellow line plunging up and down above and below the green line of inflation that is the CPI. What we're seeing as the yellow line diverges from the green line is the real world impact of that other 27 percent.
Gold is not acting as a perfect inflation hedge. Gold is not acting as "sound money" as it is not exactly keeping up with inflation.
Instead we're getting gold profits that are much higher than they should be at certain times. We also have long periods of time where gold is just flat out not keeping up with inflation at all. And then we have other periods of time where gold just spikes upwards where seemingly there's almost nothing going on with inflation.
So clearly this idea, or at least that we've seen over these last 40 years in the modern era, that gold acts as perfect money is not what is happening at all.
Now many people might say that there's an explanation for that. The higher the rate of inflation, the more people who want gold and the better gold prices are going to do. So let's take a quick look at that belief system.
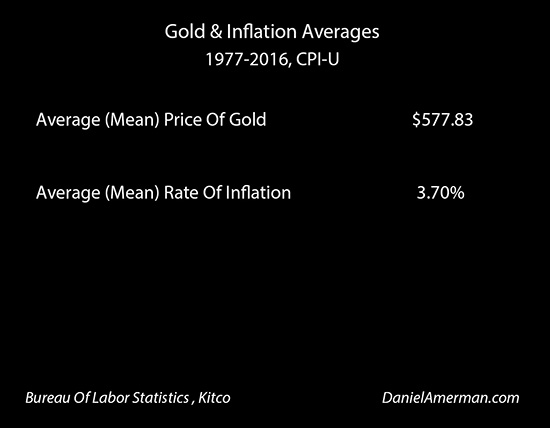
If we look at the average price of gold over the period from 1977 to 2016 - it was $577. If we look at the average rate of inflation - it was 3.70%.
So let's put both inflation and gold in percentage terms, and look at how different they are from average over this time period. By moving from the CPI to annual rates of inflation it becomes much easier to separate periods of high inflation from low inflation.
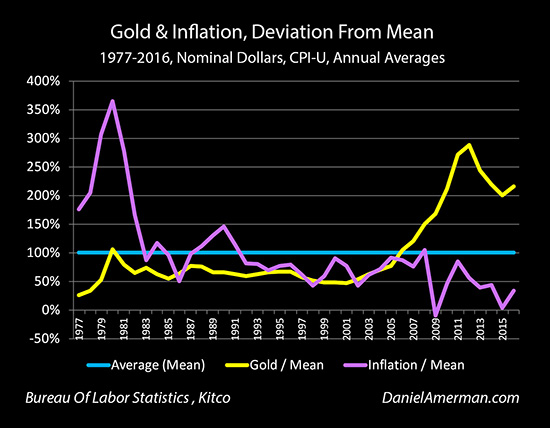
Well, the theory that high rates of inflation create particularly high gold prices works really well in the late 1970s. There's this enormously high rate of inflation (compared to the average over the last 40 years) and gold is indeed spiking upwards.
Then as the rate of inflation comes down in the early 1980s, the price of gold is also coming down. OK, that make sense.
But there is an issue when we look anywhere from the mid 1980s to the early 2000s. The purple line of annual rates of inflation is on the high side, with multiple spikes upwards. So, we should be seeing particularly high gold prices, with corresponding spikes upwards. But that just isn't visible with the yellow line of gold prices, they are below average and seem unresponsive to even the large inflationary spikes around 1990 and 2000.
From 2002 to 2006, gold prices start to "behave" again, and act the way they are supposed to if we are seeking evidence to back up the belief that rising rates of inflation are what create particularly high gold prices and the 27% lack of correlation. The purple and yellow lines are very nicely rising in synch.
Then we have this just total divergence beginning in 2007, where inflation seems to "falter", while gold prices soar upwards. We hit the financial crisis of 2008, and in 2009 - gold and inflation do the direct opposite of what they are "supposed" to do. The rate of inflation plunges even while gold soars upward.
It isn't supposed to work that way. But that is what happened, and the divergence is stunning on a visual basis. Now, there is a separate issue about whether that's really the rate of inflation or not, but as reported by the government, we have the purple line which is reaching the lowest levels it has over this entire time period, even as gold is soaring to the highest prices that we've ever seen.
So it really doesn't look like we can explain changes in gold prices simply by saying "high rates of inflation create unusually high gold prices". Yes, we have that basic 73 percent correlation underneath but the explanation for the other 27 percent doesn't seem to be what many believe it is. And this is crucial information if someone is investing in gold and expecting to maintain the purchasing power of their money.
Gold can be an excellent investment. But we need to understand this issue because it can certainly change the decisions we make. We have to understand how it really works - which is somewhat different, I would argue, than what the common beliefs are. To do this, we're going to need to "raise our game" and use two more sophisticated forms of analysis.
In the next analysis we're going to take a look at a second type of inflation - not just price inflation - that's crucially important for understanding changes in gold prices. And to give you fair warning - that data-based analysis is going to be much more problematic than this one when it comes to common beliefs about changes in gold prices.
For our third analysis we're going to use an entirely different type of analysis that relatively few gold investors use, which may be a better predictor of gold prices than inflation by itself. In the process - we will identify something that is changing fast right now, and which just might have a substantive effect on gold prices in the coming years.
What I hope to do in this series of analyses is help you to better understand not just the 73 percent - but also the 27 percent, the lack of correlation between gold prices and inflation - which could be very helpful in making better decisions.
Read Stage Two of the analysis
 What you have just read is an "eye-opener" about one aspect of the often hidden redistributions of wealth that go on all around us, every day.
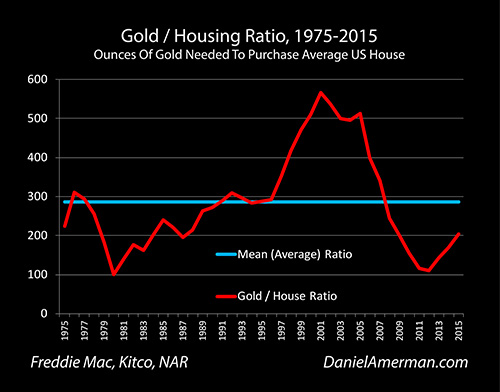
Over the last forty years, the Gold/Housing ratio has been a quite useful measure for evaluating relative values between real estate and gold. As explored in the analysis linked here, this ratio also has an interesting historical track record for identifying turning points in long-term gold price trends.
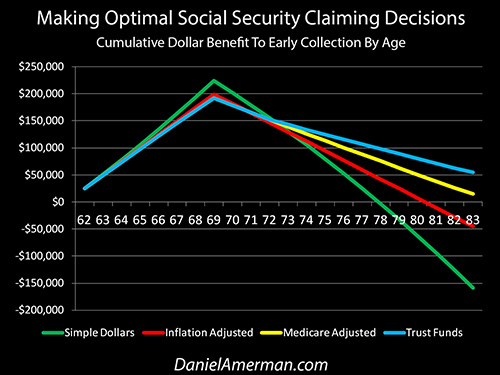
How tax rates are presented to the public can be quite different from how they really work – and the same is true of Social Security. The government strongly encourages people to wait as long as possible before collecting their retirement benefits – but as explored here, is that truly in your best interest, or are a few factors being left out?
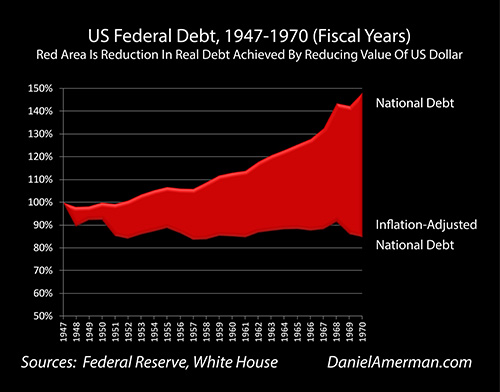
National debts have been reduced many times in many nations ─ and each time the lives of the citizens have changed. The "eye-opener" linked here reviews four traditional methods that can each change your daily life, and explores how governments use your personal savings to pay down their debts in a manner which is invisible to almost all voters.


If you find these "eye-openers" to be interesting and useful, there is an entire free book of them available here, including many that are only in the book. The advantage to the book is that the tutorials can build on each other, so that in combination we can find ways of defending ourselves, and even learn how to position ourselves to benefit from the hidden redistributions of wealth.