


How The National Debt & Surging Benefits Transform Retirement Planning
Macroeconomic Model Notes & Methodology
Daniel R. Amerman, CFA,MBA, BSBA
TweetThese notes describe a macroeconomic model which integrates the United States economy and national debt with the expected future costs of Social Security, Medicare and Medicaid. It allows the holistic modeling of various combinations of 1) interest rates, 2) inflation, 3) benefit indexing, 4) economic growth, 5) tax and 6) government spending scenarios, and shows the implications for the nation as a whole - as well as the direct personal impact upon savers and beneficiaries over a 30 year time period. All results are shown in both nominal and inflation-adjusted terms.
The core of the macroeconomic model has been "reverse engineered" from the Congressional Budget Office Long Term Outlook (CBO LTO). It is simpler than that model, but captures the key components - and most importantly their interaction - in a way which allows for holistic scenario modeling. As described in the "CBO Test" section below, when tested against the CBO LTO with very similar but somewhat simplified assumptions, it produced outcomes that were within 2% of the CBO projections in the year 2047.
The reason for the creation and use of this model - is that the future will be very different from the past for the United States, and almost no one is prepared for some of the key differences.
We are starting with the highest national debt ever. Current projections show that surging Social Security and Medicare payments to retiring and aging Boomers are by themselves enough to rapidly increase that debt over the coming years. The 2018 tax cut is likely to increase deficits and therefore the debt even more. And the Federal Reserve is simultaneously increasing interest rates, which will substantially increase interest payments on the debt, future deficits and the speed with which the national debt grows.
The above summary is not pessimism - it is simply describing financial reality. A financial reality which is likely to increasingly dominate financial markets in the years ahead, and that is also likely to be a major influence on actual saver and investor outcomes.
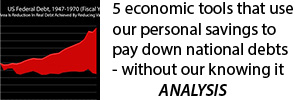
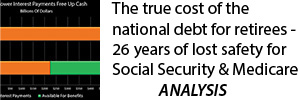
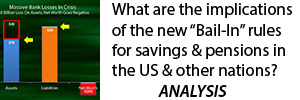
The model will be used for the exploration of the analysis matrix shown below. A summary of some of the individual analyses in each category is linked here. The current generation of this macroeconomic model was created in January of 2018. As of that month, all the linked analyses are based on earlier models, many will be replaced or updated over time with the new model.
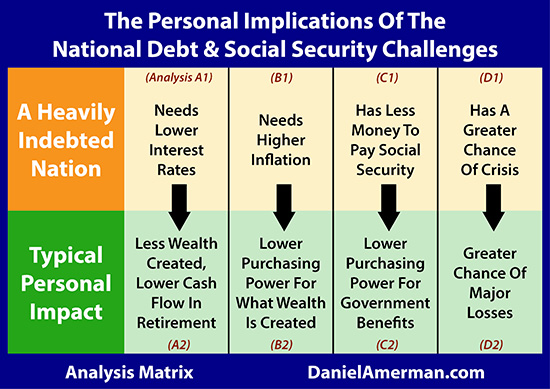
A heavily indebted nation which will be rapidly increasing spending to meet social promises has fundamental constraints that are little understood - but are of critical importance. If those constraints are violated for too long - then the chances of crisis grow much higher (the last column). However, staying within the constraints when it comes to interest rates, inflation and benefit indexing (the prior three columns) is a process that can entirely change investment outcomes and standard of living in retirement for a nation - and they are simply not being adequately taken into account in conventional retirement planning.
The government can run those models - but we are limited to what assumptions the government chooses and what scenarios it wishes us to think about. That is ultimately a political process, whether it is described that way or not.
With this new macroeconomic model we can independently run any assumptions or scenarios that we choose, with the selections being made on a financial and economic basis and with no political agenda. We can then see not only the holistic results for the nation, but also the typical personal impact on both savers and Social Security beneficiaries in each year in both nominal and inflation-adjusted terms. This process also provides critical information for long-term investors in any market when it comes to such market defining factors as interest rates, inflation, retiree spending power and the relative chances of crisis.
There are several analytical factors that are critically important for the nation as a whole in the coming years, but are little understood today. These are essential for the model, and because of their importance, each has a brief section following that gives an overview of how they are incorporated into the model.
1) The year by year escalation in the expected real (inflation-adjusted) costs of the Social Security, Medicare and Medicaid programs.
2) The coming convergence of the total and publicly held debt as the Social Security and other Trust Funds are cashed out, and theoretical internal debt is replaced with very real external debt. The scale is massive, the time is starting soon, and the impact on interest rates in general and the Treasuries market in particular may be seismic. Yet, because it has never happened before, very few people have thought through the market and investment implications of what it really means to have the Trust Funds entirely invested in funding the national debt, or what actually happens when the Trust Funds are redeemed to make cash payments to beneficiaries by a government that already doesn't have the cash to fully pay its bills.
3) Interest rates are critical for a heavily indebted nation that is growing ever more indebted, and they are also one of the most important determinants of investor outcomes across all markets. But to accurately model the impact of changing interest rates requires taking into account a) the weighted average life of the national debt; b) the convergence of the total and publicly held debt; c) the rate of growth in the national debt; and d) inflation and real interest rates. Without including all four factors, it is simply impossible to get good numbers for understanding the true constraints that are imposed by various interest rates at different points in time.
The full 2017 macroeconomic model results are available as a research report which is linked here. It contains almost 600 pages of charts and graphs supporting the detailed exploration of 25 different holistic scenarios for interest rates, inflation, benefit indexing, economic growth and taxes. In the process, the research report provides an entirely different take on retirement planning, and it shows why what is likely coming is quite different from what conventional retirement planning is preparing for.
The macroeconomic model also integrates with an equally powerful financial strategies model which provides solutions for the analysis matrix. The assumptions of the macroeconomic model for each scenario feed into the financial model and produce the corresponding nominal and real results in cash flows, equity and yield for each investment strategy. The new generation of this combined body of work - which has been more than ten years in development - will be presented in person for the first time in April of 2018, more information is available here.
The Core Model - Cash Flows & The Deficit
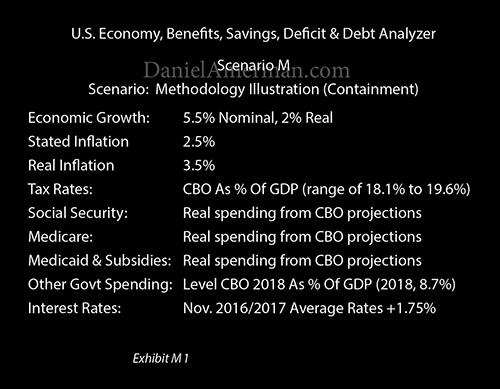
The beginning point for the macroeconomic model is the assumed economic growth rate, which is stated in both nominal (not adjusted for inflation) and real (inflation-adjusted) terms.
The stated rate of inflation is what governs the inflation indexing of Social Security, Medicare and Medicaid benefits.
The real rate of inflation is used for the calculation of all the inflation-adjusted schedules.
Tax rates are stated as a percent of GDP. In this particular scenario, they are calculated using the same percentages as the CBO base scenario in each year, so that over time between 18.1% and 19.6% of the national economy is available as revenues for the federal government.
Taxes are also therefore dependent on the size of the economy in any future year. This is appropriate as individual and corporate taxes as well as most other categories do vary with the size of the economy and the wealth of the nation. The percentages can of course be varied to determine the impact of tax cuts, tax hikes or other changes.
The benefit numbers (Social Security, Medicare & Medicaid) are based upon using the CBO LTO to determine fixed annual costs as estimated by the government in each future year, for each program. So long as the stated rate of inflation equals the real rate of inflation, then the real payments for each benefit program will exactly equal the CBO forecast - regardless of the rate of economic growth.
A crucial component of this program is the ability to model "partial inflation indexing" for each of the benefit categories, where overall spending does not in fact keep up with the real rate of inflation. In the example above, aside from the demographic factors that are built into the CBO assumptions, costs per participant are assumed to increase by 2.5% per year, while the real rate of inflation that determines present value and real economic growth grows by 3.5% per year.
This then lowers the real cost of the programs to the government, even while reducing the real value of the programs to beneficiaries. As explored in the series of analyses linked here, there are compelling reasons to believe that Social Security is in practice already only partially inflation indexed.
Other government spending is expressed as percent of GDP. In the example above, it is held flat at the CBO estimate for 2018, rather than being reduced in future years as is politically projected. This can be fixed in real terms rather than varying with the economy, when desired.
Interest rates start from a base of the average of average Treasury borrowing costs in November of 2016 and November of 2017, which is equal to 2.25%. While Fed rate increases had already been occurring, these rates are still close to the prior floor as a result of both yield curve shifts and the weighted average life of the overall debt. Whatever rate increase is shown is assumed to occur immediately, however, it still nonetheless takes many years to change the average interest rate paid on the national debt as further explored below.
All cash flow and debt schedules and graphs are available in both nominal and real (inflation-adjusted terms).
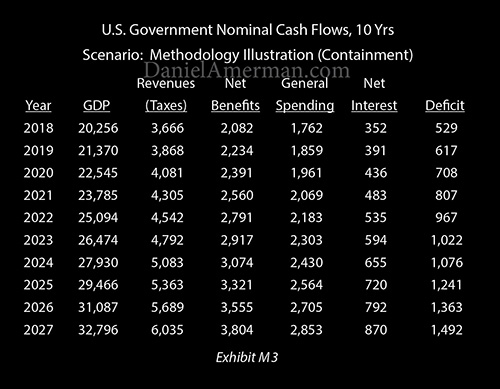
The example above is in nominal dollars, and it shows GDP growing at an annual nominal rate of 5.5% per year. The starting value is $19.2 trillion, which exactly corresponds to the ending 2017 (fiscal year) nominal GDP from the CBO LTO.
Revenues are the base CBO LTO assumptions for taxes as a percentage of the economy, multiplied by the size of the economy.
The "Net Benefits" column is the sum of Social Security, Medicare and Medicaid payments. The word "Net" is particularly important, as Medicare is shown net of Medicare premiums and other revenues. This is of great importance for the government and retirement beneficiaries, as explored in the analysis linked here.
The "General Spending" column represents all federal government spending except for "Net Benefits" and "Net Interest".
"Net Interest" payments mean interest payments on publicly held debt only. Because interest payments on the Trust Funds are expenses for one part of the government (the Treasury) and income for another part of the government (such as the Social Security Administration), for the government as a whole the income offsets the expense, and the interest payments are netted out. This is crucial for understanding what will be changing in the years ahead, as discussed below.
The Core Model - The National Debt
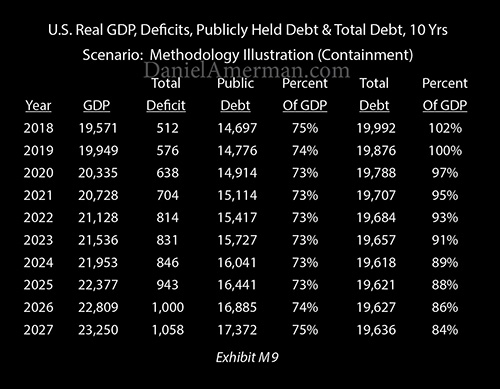
The total deficit carries over into the debt schedules, and in this case it is shown in real (inflation-adjusted) rather than nominal terms. The previous debt, plus the ending deficit equals the new ending debt. This is then compared to GDP, which generates the "Percent Of GDP" column.
The national debt is displayed two different ways, representing the total national debt and the publicly held national debt. The difference between the two is the national debt that is owned by the Social Security and other Trust Funds. There are multiple crucial financial implications of there being two types of debt, as is discussed in more detail in the following section.
It should also be noted that this particular example is a containment scenario, which results in a much lower national debt in future years than what is shown in the CBO LTO.
2018 Tax Cuts & Spending Increases
This model is "reverse engineered" from the March of 2017 CBO LTO, which was the most recent available in January of 2018.
Since that time, Congress has passed a combination of tax cuts over a ten year period, and spending increases for 2018 and 2019. These have been added to the model base scenario as of February of 2018, and include a $1.455 trillion tax cut which evenly reduces revenues over a 10 year period, as a dollar modification to the tax revenues as a percentage of GDP calculation. Spending for 2018 is increased by $143 billion, and the increase for 2019 is increased by $153 billion, with each as dollar modifications to the general government spending as a percentage of GDP calculation.
Two Sets Of Books & Cashing Out The Social Security Trust Funds
The United States government quite openly maintains two sets of financial books.
In one set of books, we have the largest and safest savings account in the world. These savings are the Trust Funds, where $5.6 trillion of financial reserves are held for Social Security as well as federal civilian and military employee retirement programs. Everyone's mandatory payroll deductions were taken over a period of decades and invested in the safest of all securities - United States Treasury obligations, backed by the full faith and credit of the federal government.
This set of books reassures the general public that the money is there to pay them, because their payroll taxes were saved for them - and it would be absurd or even reckless to suggest otherwise.
There is a second set of books, such as those kept by the Congressional Budget Office (CBO) and the White House Office Of Management and Budget (OMB). In this set of books, which is used for estimating future budget deficits and national debts, only the $14.7 trillion in "publicly held debt" (which excludes the Trust Funds) is treated as being real debt, and the only real cash expense going out into the future is "net interest expense" - with that being interest paid to the public.
Because the Trust Funds are money that the government owes to itself, it would be absurd to treat one part of the government paying another part as real cash flow for the government as a whole, or one branch of government paying another branch interest payments as real expenses or income.
This is exactly what the CBO and OMB do with their budget projections. They net out the Trust Funds and net out the interest payments on the Trust Funds as not really existing.
The two sets of books contradict each other and cannot be true simultaneously. What very few people are taking into account, however, is that the two books have to reconcile - and what will drive the reconciliation is the spending down of the Trust Funds. When all the Trust Funds are depleted, then there will be just one set of books.
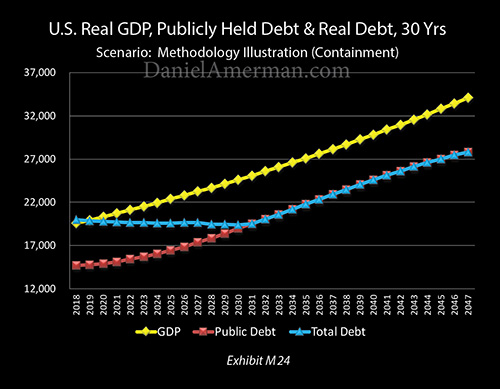
This reconciliation is built into the CBO LTO, albeit not explicitly discussed in detail, and it is also built into this macroeconomic model, as shown above with the future merger of the blue line of total debt and the red line of publicly held debt.
The issue is that the government needs new cash to make payments - but it doesn't have the cash to do so. So what happens, in both this macroeconomic model and the CBO LTO is that internal debt is rolled over into external debt that is sold to the public, and the proceeds of that sale are what provides the cash to pay the retirees.
In general terms and with normal externally held Treasury bonds, a situation of continually rolling over the debt has been the unquestioned norm for decades as the national debt has grown in almost every year. A bond is sold, it comes due, another bond is issued, and the proceeds from the new bond are used to pay off the old bond. Then when that "new" bond comes due, a still newer bond is issued, and so forth. This means that government debts that were originally taken out in 1950, and in 1970, and in 1990, are almost entirely still with us, although they may have been effectively "refinanced" ten or more times in the interim.
With the exception of short term revenue timing situations or the few years with budget surpluses, the modern era federal government never pays back the principal of its debt with our tax monies, but rather it always uses new debts. This is something the general public likely rarely thinks about, but the neither the security for Social Security nor the future interest payments and debt of the federal government can be understood without understanding how these debt "repayments" actually work.
As these retirement funds including Social Security get paid down, what happens is there is an ongoing rollover of principal from the private captive market of these Trust Funds, to bringing in actual real money from actual investors who want actual cash back.
As this happens, net interest payments jump upwards. There are no real cash interest payments on the internal debt that the government owes to itself, but as each theoretical internal obligation is rolled over into a very real external debt, then interest has to be paid, and that feeds into both deficits and the size of the national debt.
Another issue is that these interest rates are based on the market at that time. So if we are in a higher interest rate environment, the process of rolling over forces an interest rate reset to then current rates.
As we go forward through time and these Trust Funds pay down, they don't on the surface increase the level of government debt. What they actually do instead is that over time they radically increase the amount of money that the US government must take in from external investors – in a manner that does not show up in the usual bottom line.
So the source of security for Social Security and other government retirement programs isn't saved money or investment assets at all - it is the solemn promise from a heavily indebted nation to go borrow more money and use that money to make the actual payments to the retirees.
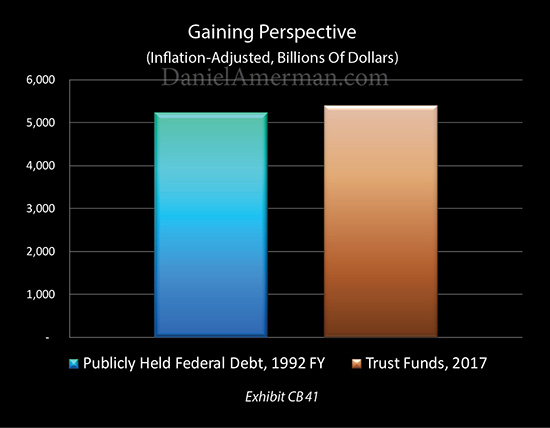
Exhibit CA40 places this the extraordinary scale of this new borrowing in perspective. By 1992, the federal debt held by the public - the amount financed by external investors - had reached $3.1 trillion. This represented over 200 years of federal borrowing. However, the dollar was worth substantially more 26 years ago than it is today. When we adjust for inflation (CPI-U), the total publicly held debt in 1992 was equal to about $5.2 trillion in 2017 dollars.
The amount of the Trust Funds is currently about $5.6 trillion. As they are redeemed and bonds are sold to pay retirement benefits, external investors will have to be found for that entire amount.
What that means is that even after adjusting for inflation, the government will have to raise more new money to cash out the Trust Funds than the total publicly held federal debt outstanding in 1992 - after over 200 years of previous deficits and borrowing. With all the deficits outside of the Trust Funds occurring on top of that.
That is a fantastic sum of new money that needs to be raised - from something or somebody - in what is usually projected by the government to be somewhere within the next 10 -17 years (with the dates varying depending on the agency and the assumptions).
For those wishing more information on these issues, more detailed analyses are linked here, here and here.
The particular assumptions for the annual depletion of the Trust Funds in the macroeconomic model are based upon the CBO LTO. As a simplifying assumption, all the Trust Funds are assumed to deplete at the same rate as the Social Security Trust Funds.
Debt WAL Considerations
In understanding how the Fed increasing interest rates impacts the budget, it is critical to keep in mind that the national debt has short term, medium term and long term components, with a weighted average life of about 5.8 years. So rate increases by the Fed initially fully impact only short term borrowing, and then slowly increase the average interest rate paid by the government as medium term and long term bonds gradually mature and are rolled over at the new and higher interest rates. This analysis uses a simplified term structure for the federal debt, with an average life of 5.5 years, and assumes that all rates move together.
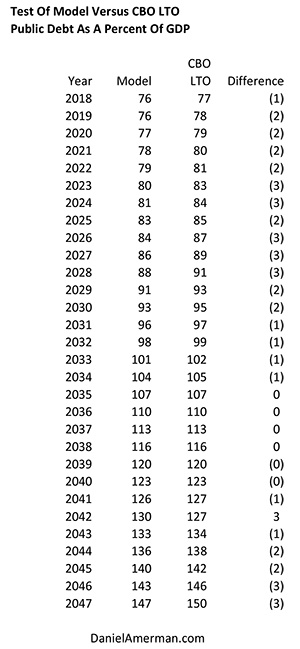
Model Test vs CBO LTO
Using similar but simplified economic, inflation and interest rate assumptions, the macroeconomic model produced the result of a ratio of public debt to GDP of 147% in 30 years, while the CBO LTO (version of March 2017) produced the result of a 150% ratio. That is a modeling difference of about 2%, for 2 complex models each of which involve multiple intertwined exponential series over 30 compounding periods. A table of the annual differences between this model and the CBO LTO is shown below.
The biggest differences have to do with the treatment of the Trust Funds and the term structure of the debt. The CBO LTO uses the actual term structures of the debt, the differing interest rates between the internal and external debt, and a different drawdown schedule for the other Trust Funds besides Social Security. This model uses a simplified term structure with equal interest rates for internal and external debt, and with all Trust Funds being drawn down at the rate of the Social Security Trust Funds.
This model produces a slightly lower amount of publicly held debt in many time periods, with the maximum differences occurring in 2020s, likely as a result of the simplifications of the term structures and the Trust Funds drawdowns.