


This Trick Lets Politicians Steadily Cut Retirement Benefits While Fooling Voters - Are You At Risk?
by Daniel R. Amerman, CFA
The United States government has a very powerful "trick" up its sleeve when it comes to cutting the cost of benefit payments that are owed to current and future retirees over the coming decades.
The source of the government's savings will necessarily be the standards of living of tens of millions of Social Security recipients as well as other retirement beneficiaries. For given the fantastic sums of money that are owed, quite simply the only way for the government to pay, let's say 50% less, is for the individual retirees to receive 50% less.
And here's the beauty of it from the politician's perspective: most voters aren't even aware of the trick, let alone understand how it works. Which means that benefits can be cut, and cut, and cut – without elections being lost. This is true whether the elections are in the US – or in other nations facing similar problems with aging populations, already heavily indebted governments and expensive retirement promises
And because this trick is also invisible to the way retirement benefit decisions are usually evaluated – it means that millions of people are getting bad advice and thus unknowingly making poor decisions, that could unnecessarily reduce their future standard of living.
To make better decisions – and find ways to protect ourselves - we need to start by understanding exactly how the trick works.
Setting Up The Trick
Let's begin with the table below, which looks at inflation adjustments for retirement benefits, and illustrates the difference between simple dollars and spending power.
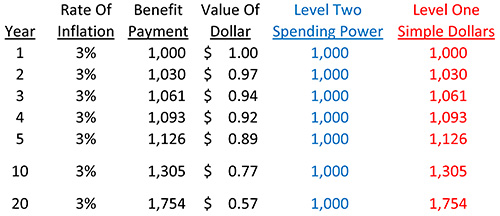
What needs to be understood is that when we get inflation adjustments to our salary or retirement benefits, while on the surface it may seem like we're getting a raise, we're actually not – rather we're being compensated for the loss of the purchasing power of our dollars.
The table shows the effects of a 3% rate of inflation on a $1,000 benefit payment that exactly keeps up with the rate of inflation. As seen in the "Benefit Payment" column, we do get 3% more dollars each year. However, because of inflation the dollar buys 3% less each year, as shown in the "Value Of Dollar" column. So one offsets the other, and a benefit payment which exactly keeps up with inflation should maintain an exactly level purchasing power, as indicated in the "Level Two Spending Power" column.
Creating The Trick
Where the "trick" comes in is when the government very deliberately creates a situation where there isn't one rate of inflation – but two rates of inflation.
This next table is a round number illustration of what happens when retirement benefits increase at a different – and lower – rate than the overall rate of inflation.
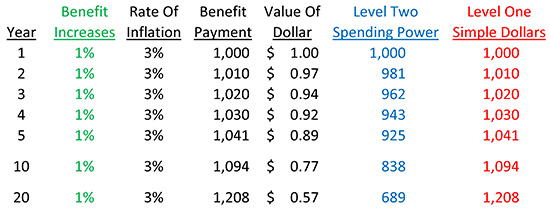
The way the average person sees it, which is the way politicians present it, and how it is usually described on television and in the newspapers – is that there is a steady increase in payments. The focus is strictly on the "Level One Simple Dollars" column, where the government checks start at $1,000 a month, they plainly rise to $1,010 the next year, and are unmistakably up over $1,200 a month by the time we are 20 years out.
However, what really happens when the number of dollars coming in goes up by 1%, but the value of what each one of those dollars will buy for us goes down by 3% - is that our spending power falls by about 2% each year. This is not good, obviously – but the initial difference may not seem that great. As shown in the "Level Two Spending Power" column, the spending power of each monthly benefits check falls by $19 the first year, then $19 the 2nd year, and $19 the third year, and so forth.
Now is that really such a big deal? It may not appear to be, particularly if one is not currently retired and trying to cover expenses in the real world without a safety margin.
Tricking Millions Of People For Decades
The advantages to the government of creating this small annual trick of using the difference between two rates of inflation to slowly chip away at the real cost of future retirement payments, is that the effects are cumulative, they're permanent, and they produce powerful results over time. Indeed, the surprising strength of this little "trick" over time can be seen in the graph and table below:
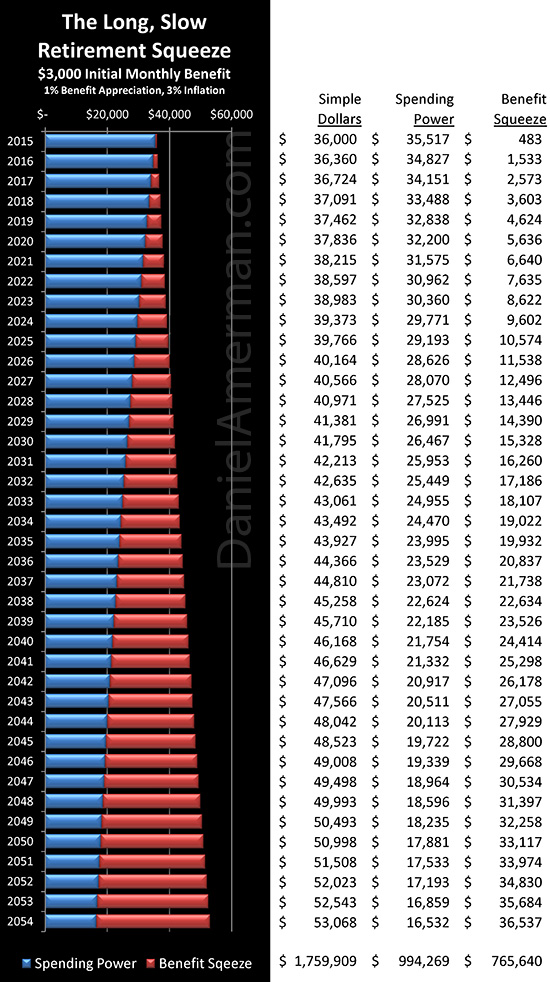
The above graphic and table show retirement benefits over a forty year period, starting in 2015. The sum of the two bars is the benefit checks paid out to a retiree in a year, and is shown in numeric form in the "Simple Dollars" column.
The bars above show retirement benefits over a forty year period, starting in 2015. The sum of the two bars is the benefit checks paid out to a retiree in a year, and is shown in numeric form in the "Simple Dollars" column.
As shown, a $3,000 monthly benefit check would bring in an annual total of $36,000 in 2015. Increase the checks by 1%, once per year, and the annual befits are up to $39,766 for 2025, and up to $43,927 by 2035.
For a retiree in the year 2040 – who could be 65 today and thus 90 years old then, or 45 today and 70 years old then – the benefit checks would be up to a quite respectable annual total of $46,168, which is getting close to $50,000 a year. Not bad!
Spending Power & Time
This is where the "trick" comes in. It is something that government economists understand very, very well indeed, but the average person does not, which is just how powerful even a relatively low rate of inflation can be, when given enough years to work with. And particularly for someone who is middle-aged right now – the final years of retirement are (hopefully) a very long ways away, meaning that the "trick" will have decades to slowly destroy the value of the retirement benefits.
The inflation rate shown of 3% is low, and historically supported, as it is about the average annual rate of inflation in the United States between 1950 and 2000. (And if the rate turns out to be 4% or 5% instead – or something quite a bit higher – the "trick" becomes much more powerful, much faster.)
Appearance is simple dollars. Reality on the other hand is spending power, what your benefit checks will actually buy for you in retirement, and it is represented by the blue bars and the spending power column. The difference between reality and appearance is ─ illusion. A trick.
This illusion is the red bars, and is also shown in the "Benefits Squeeze" column. It starts fairly slowly – only $483 in the first year.
(This result is slightly different than our first two tables, which were kept as simple as they could be. The bigger table accurately takes into account the inflation losses each and every month, with the annual adjustment occurring in arrears.)
But the squeeze picks up speed rapidly. By 2019 the surface of simple dollar benefits is $37,462 per year, the reality of spending power is $32,838, and the illusion is up to $4,624 per year.
By 2024, the benefit squeeze has reached $9,602, or almost $10,000 per year.
In 2037, we reach an absolutely crucial point. Our benefits are $45,258 per year, or almost $10,000 more than the $36,000 per year we started with. Yet, this is the year where the trick reaches $22,634 per year – and for the first time, actually exceeds the reality of spending power of $22,624 per year. Illusion is now completely dominant, even as the standard of living that can be supported in retirement continues its slow collapse.
By 2046, which could be someone who is currently 50 at age 82, illusion has grown to more than half again the size of the reality of spending power, with real spending power down all the way to $19,339, even while the annual level of the trick is up to $29,668.
After 32 straight years of benefit increases, and even with an overall low rate of inflation – those that heavily depend on their retirement benefits to support them will have ever so slowly drifted deeper and deeper into poverty, with an ever lower standard of living that nonetheless continues to fall a little more each year.
Now that is a bleak scenario. But would the government really do such a thing?
Extraordinary Motivation
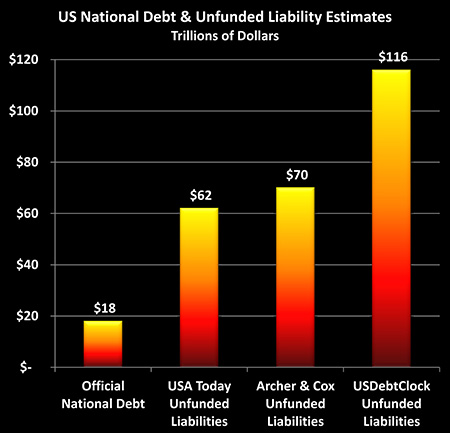
In 2012, the newspaper USA Today calculated that unfunded Social Security obligations alone were in excess of $22 trillion – an amount well in excess of the official national debt of $18 trillion. Add in other unfunded obligations - primarily Medicare - and in 2011 USA Today found that the total comes to about $62 trillion of "off-balance sheet debt". That is, the federal government uses a very special accounting that is not legally available to corporations or individuals, precisely so it can report lower debt totals – and lower annual deficits – than any other sort of entity would be able to do.
Add this to the official national debt of $18 trillion, and the total is then an astonishing $80 trillion (although it has grown in the last 2-3 years since the report was done).
As reported in the Wall Street Journal in December of 2012, when Archer and Cox (former chairman of the House Ways & Means committee, and former SEC chairman respectively.) took a look at the true level of national debt, they found (primarily based on the figures from the Social Security and Medicare trustee reports), that the true national debt was $87 trillion, consisting of $17 trillion in (then outstanding) official debt, and $70 trillion of unfunded obligations, most of which were payments to future retirees.
And for those who are familiar with the well-known usdebtclock.org website, which keeps running real time totals of estimated US national debts and assets, as of December of 2014 they showed that the total unfunded obligations of the US government were about $116 trillion, which when added to the official debt, brings the total to $134 trillion.
All of these totals are based upon the assets of the Social Security Trust Fund – which are IOUs the government has written to itself – as being real securities, real assets. Some say the assets are there, and others not, but as examined here, the full story is stranger still when it comes to the Trust Fund assets, and where the money will actually be coming from as the fund is spent down and money paid to retirees.
So therein lies the incentive for the government ─ and it is a major one. Do we have an idea about the particulars when it comes to getting there?
Five Levels Of Inflation
This next step could be what determines your future standard of living.
Our starting point is there's no such thing as a standard inflation rate, whereby everyone could objectively measure and independently come up with the same result, like say, the temperature at which water boils at sea level. Instead there are myriad inflation rates.
We each have our personal inflation rate, that changes each year of our lives. Inflation measures changes in the purchasing power of the dollar, so to calculate it, assumptions have to be made about what we purchase. This means our inflation rate is different in our 20s, our 30s, our 50s – and our 70s. This is because the particulars of what we buy changes with time, location, family circumstances, technology, interests and age.
(Those who insist inflation is about the supply of money rather than prices, are encouraged to read this resource when it comes to inflation and making informed financial choices.)
Through a very complex process with numerous assumptions – government statisticians create elaborate models for the nation as a whole that are supposed to be representative of our average personal rates of inflation. The CPI-U is the best known, and is supposed to measure prices for urban consumers.
There are many possible ways of doing that – and there is a very powerful political incentive when working through the very large number of available assumption and methodology choices, to consistently make choices that generate numbers on the low side. Because that makes the economy look better, which is quite helpful for elections, and it also reduces any inflation-linked payments the government has to make. Like Social Security and retirement benefits.
Except, the CPI-U isn't what Social Security is based on, for retirement benefit COLAs are supposed to be based on the often lower CPI-W, which is a wage-linked measure of inflation. Meaning there is an even stronger political incentive to make assumption and methodology choices for calculating the CPI-W, that are skewed to reporting lower rates of inflation.
Except, the current CPI-W generates larger increases in retirement benefit payments than the government would like, which is why there have been the bipartisan discussions between Congress and the President about moving the Social Security inflation index to an alternative "Chained Consumer Price Index" measure, which consistently generates a lower rate of inflation than the CPI-W.
The reasoning for that proposed change of inflation measures? It is quite explicitly to hold down annual increases in retirement benefit payments. In other words, the purpose is to generate our chart of red and blue bars, setting off a slow but unstoppable reduction in retiree standards of living, that will build year after year ─ precisely because the government knows full well about its "unfunded liability" problem.
Except, sometimes even a Chained Consumer Price Index might not be low enough, in which case the government can again do what it did in the fiscally stressed years of 2009 and 2010 when there were no benefit increases at all. Indeed, there was a total of three years between the benefit increase of 2008 and the increase in 2011.
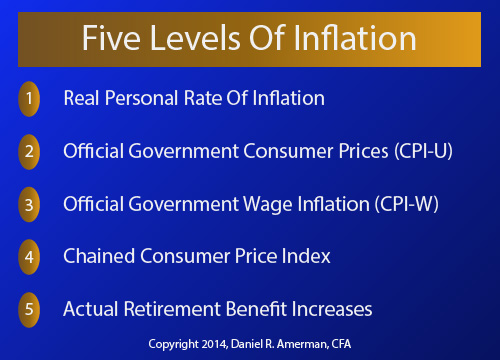
So, in summary, we have at least the five different rates of inflation shown above. There is our personal cost of living, there is the possibly quite different official rate of inflation, and then there are potentially another three levels of benefit reductions relative to that rate of inflation, each one of which can increase the size of the "trick", in any given year.
Taking it to the next level, the source of the trick is two exponential series diverging over a long period of time in a counterintuitive manner which the general public does not understand. Except, there are really five exponential series. And most are based on highly complex models with numerous little technical factors that can each be adjusted at will in a way that the average reporter would never understand – let alone the average voter.
So, numerous very technical little skews towards reporting lower inflation rate statistics can be massaged in many places, with each one being perhaps individually defensible. No fraud needed, no grand conspiracy, no indictable phone calls or e-mails, no smoking gun the public would ever understand – just a very technical process slowly and subtly moving towards a goal of overwhelming financial importance for the government and politicians.
Is that just a bit complex? How many voters understand the complexity? I would argue very few. Does that lack of understanding give politicians a certain degree of... flexibility?
The bottom line isn't complex at all, however.
For some current and future retirees, the bottom line may be restaurant meals being replaced by frozen meals, and frozen meals later being replaced by rice, beans and noodles.
The bottom line could be scrimping for a series of repairs to an aging automobile that can't be replaced, while one's clothes get steadily older.
The bottom line could be space heaters in winter and fans in summer, because of the expense of keeping an entire house at a comfortable temperature.
The bottom line is very human and easy for anyone to understand – however misleading the complexity may be in getting to that place.
This Has Been Coming - And We've Known It
Now, for most people in my generation and those younger, this idea that we may not get all of our retirement benefits is not exactly a news flash.
Like many of my peers born in the later years of the American Baby Boom, I have assumed for decades that Social Security was unlikely to be there for me to the same extent that it was for my parents' generation. The financial impact of aging Boomers on the Social Security and Medicare system has been the subject of numerous analyses and discussions for quite some time now, and polls over the years have also shown that most middle aged people and those younger are quite aware of the danger – and are skeptical about their future benefits.
They are right to be concerned – but what needs to be understood is that this is a long-term process that is only just getting started. The great majority of Boomers have not yet retired, and for those who have retired – most have many years of retirement still ahead of them.
The pressure of the unfunded retirement liabilities builds year, by year, by year, in an ongoing process that is as unstoppable as aging itself. Referring back to the graph, the "trick" is also a very long term process – where the longer out it goes in time, the more powerful the reduction in real retirement benefits that are paid.
So that point at which the maximum number of retirees are all due to be receiving their benefits – is also the same time when the long term trick is starting to reach full strength. Surging benefit claims meet ever lower purchasing power for those claims, under the cover of a pervasive illusion that while highly politically advantageous for those in power – does not change the bottom line for retirees.
For as mentioned at the beginning of this analysis, ultimately, the only way to cut the government's real cost of paying retirement benefits by 50% – is to cut retirement standards of living by 50%. Everything else is just smoke and mirrors, however technical the vocabulary or obscure the underlying economics and statistics.
Another very unfortunate aspect of this process is that it exacerbates the financial issues that can be associated with what is otherwise a wonderful thing – that being a long lifespan. For good reason, one of the biggest fears of retirement investors is outliving their money.
The benefit side of the retirement finance equation is the subject here, but a version of the same issue applies. The longer one lives, the lower the spending power of the benefit. So with our example, someone who had almost $30,000 in spending power ($29,193) in 2025 at age 70, would have only $23,995 at 80, and would be down to under $20,000 per year by 90.
And if one is relying upon a combination of retirement benefits and drawing down savings – then having issues with both the investment side and benefit side in tandem can exacerbate the problem.
Illusions & Bad Benefit Decisions
Unfortunately, some of the most common decision aids for Social Security benefit decisions do not properly include even one level of inflation – let alone two levels or five levels.
As you may have seen, there are numerous claims that waiting to age 70 before beginning to collect Social Security benefits can create a six figure advantage, or a 30%+ advantage, or words to that effect.
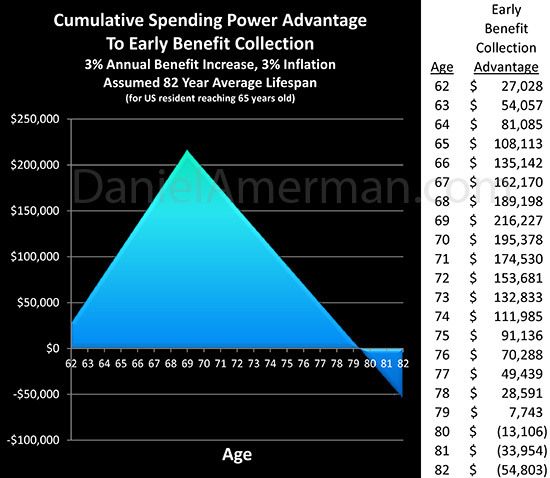
As analyzed here, however, and shown in the graphic above, all we have to do is accurately include the effects of even a single level of inflation, with benefits increasing at exactly the rate as inflation, and "poof", a full two thirds of the supposed advantage to waiting instantly disappears – because it never did really exist.
As discussed in that linked article, when we take into account benefits not fully keeping up with inflation, or with the unfunded liability problem, then potentially everything changes when it comes to such retirement benefit decisions.
Truth, Tricks & Offsets
Politicians have an enormous incentive to be deceptive with the general public when it comes to retirement benefits. If they tell the unvarnished truth to the voters in a way the voters fully understand – then they stand a very good chance of being voted out of office. Use the "Long, Slow Retirement Squeeze" trick, however, and the general lack of understanding means possibly no negative impact at all in any given election cycle.
For the minority who do understand – what can we do about it?
If benefits were being cut in a truthful manner – probably not much. That is, if the government were to just openly begin cutting benefits by 2% each and every year, then either we find a way of generating enough retirement investment income to offset those losses, or we take the losses. This could involve deferring retirement, and perhaps working for as long as our health will allow, and then afterwards accepting a lower standard of living than desired – potentially much lower.
But that is not the path of a benefit squeeze. If instead of acting directly and openly cutting benefits, the government acts indirectly by using an economic force to create the trick, it can indeed get to same destination of slashing retirement benefits – but without the otherwise overwhelming political costs.
However, the interesting part is that by the government taking the indirect route, a very different possibility is created for those who wish to actually do something about their standard of living in retirement. Which is to invest not for declining benefits, but rather, invest in such a ways as to profit from the economic force that creates the declining benefits.
The goal in this case would be to create an offset (or more than an offset). Where whatever squeezes down on the benefit side – creates profits on the investment side. So if there is steady, low inflation reducing spending power on the benefits side of the retirement equation – that same steady, low inflation produces the profits on the investment side. If inflation jumps and more rapidly reduces the spending power of benefits – that same jump in inflation also drastically increases the investment profits, so they are there when needed the most.
The other key consideration about such an offset – which could also be called a retirement lifestyle hedge – is that it can't be deferred. The destruction of the value of retirement benefits is a long term mathematical process, where the initial small changes create far greater changes down the road.
For an offset to work – the same component of time is essential. If we wait too long, the damage is too great – and a low or moderate rate of inflation will not be enough to produce the offset needed. However, if we act early and set into motion a strategy that prospers with the exact same economic force that produces the retirement squeeze – then that same process, with the same fuel, will generate what we need.
Unfortunately, the average person is unlikely to be prepared or able to do this.
They do not fully understand the trick, and lacking awareness and knowledge, they lack defenses. This lack of knowledge and lack of defenses means that this squeeze on benefits will likely succeed with the overwhelming majority of retirees.
Once the trick is understood, on the other hand, your alternative is to take personal responsibility for your own outcome, and further educate yourself. You can seek to fundamentally change your strategy, even turn it upside down – and personally turn that long, slow retirement squeeze into a potentially quite reliable source of offsetting income.
 What you have just read is an "eye-opener" about retirement benefits in a world with heavily indebted governments, aging populations, and very expensive future promises.
 Another retirement benefit "eye-opener" is linked here, and it explores how explicitly including the number one threat to future retirement standards of living – inflation – inside the benefit decision process, can change everything.
 Retirement lifestyle is determined by both benefits and savings. Linked here is a related "eye-opener" that shows how the government's suppressing interest rates can reduce retirement investment wealth accumulation by 95% over thirty years, and how low interest rate policies are profoundly reducing standards of living for those already retired.
 Another investment-related "eye-opener" (linked here) explores a hidden and powerful redistribution of wealth, showing how governments can use the 1-2 combination of their control over not only interest rates but also inflation, to actually take wealth from unsuspecting private savers in order to pay down massive public debts.

If you find these "eye-openers" to be interesting and useful, there is an entire free book of them available here, including many that are only in the book. The advantage to the book is that the tutorials can build on each other, so that in combination we can find ways of defending ourselves, and even learn how to position ourselves to benefit from the hidden redistributions of wealth.