

Next Recession: Concentrating Future Losses & Bringing Them Forward In Time As Profits
By Daniel R. Amerman, CFA
TweetIf there is another recession in the next 1-2 years, then the Fed is highly likely to respond by swiftly moving Fed Funds rates back down to zero percent.
One likely result is that millions of investors will lose 83% or more of their future income over a period of years.
The money won't all actually be lost, however. Instead, much of it will be brought forward in time and passed through to a different group of investors as profits - in concentrated form.
In this analysis, we will focus on understanding how an unintentional - but necessary - byproduct of the Fed's dilemma and known plans when we enter the next recession, will be to strip wealth from some investors, and to bring that wealth forward in time to be "caught" by other investors.
This analysis is part of a series of related analyses, an overview of the rest of the series is linked here.
Dramatic Profits From Zero Percent Interest Rates
We currently have multiple warning signs of a possible recession within the next one to two years. As explored in previous analyses in this series, if we do have a recession then we already know in advance what the Federal Reserve will likely do as a matter of policy (and what it is being discussing in meetings of the Federal Open Market Committee).
As a starting point the Fed is almost certain to swiftly return Fed Funds rates back down to zero percent.
Most people are probably hoping that those rates were a brief anomaly, never to be seen again, but as previously reviewed - the Federal Reserve doesn't agree. Instead, the staff at the Fed thinks that episodes of zero percent interest rates "could become more frequent and protracted than in the past" (analysis link here).
The consequences could be dire for many strategies - particularly many retirement investment strategies - but what needs to be understood is that there are also likely be some extraordinary profits to be earned along the way.
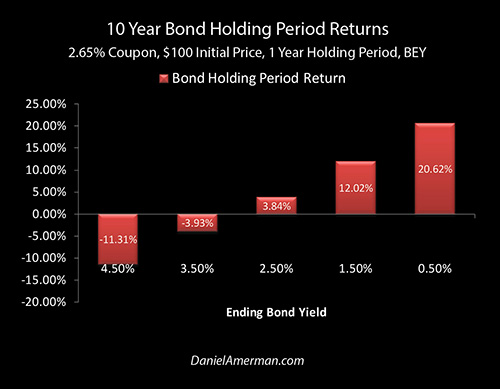
As explored in detail in the immediately preceding analysis in this series (link here) a return to zero percent interest rates could very well produce a 21% one year holding period return for those who are invested in 10 year treasury bonds.
However, what is critical to understand is that the potential 21% return has a source, and it is not a true creation of new wealth but rather a transfer of wealth. Every dollar of the profits will be coming from other investors, with most of them having no idea that their earnings are quite literally being transferred to other people.
Understanding The Transfer Of Wealth
To understand the transfer of wealth that creates these stunning yields and price gains for one side - and major losses for the other side - we need to better understand the sources of wealth.
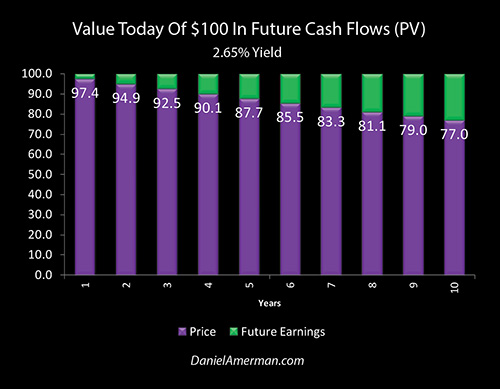
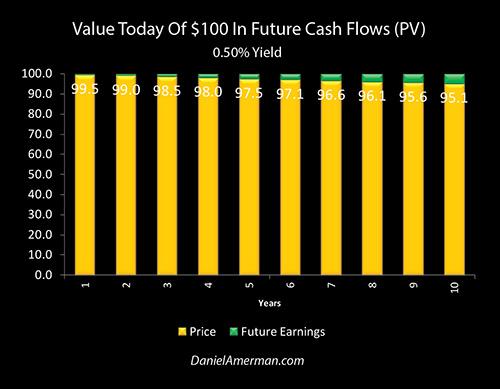
The graph above shows the value today of $100 in future cash flows, which is also known as the present value. At a 2.65% yield, we buy that $100 in the first year for $97.40, and we are ahead by $2.60 when we receive the full $100 in a year. As we go out five years, we pay $87.70, and we eventually get our money back plus another $12.30. If we go out 10 years - which is when we get the principal payment for a 10 year Treasury bond - then we pay $77 today, which means that we will get paid $23 dollars in future earnings.
However, to understand where that $77 purchase price comes from, we need to flip our perspective and look at the investment of cash over time.
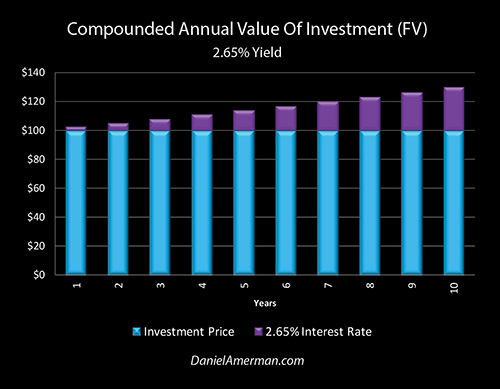
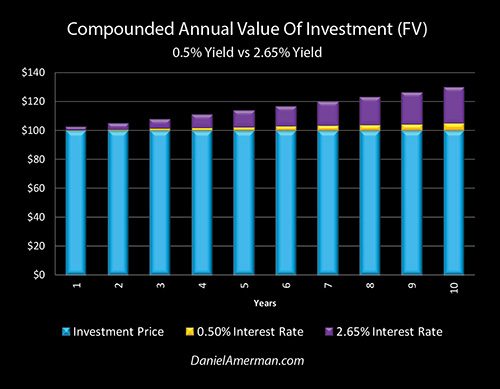
When we flip our perspective, the blue bars are now our starting investment of 100 dollars. As we go out through time and we earn interest upon that investment at a 2.65% rate, then that cumulative income is being shown as the growing purple bars that are stacked on top. Each year's annual earnings are then reinvested, so that we get not just interest, but interest on interest, i.e. compound interest.
The purple bars of the cumulative interest income from our investment steadily build over time. One hundred dollars becomes worth $102.65 at the end of one year, it becomes $113.97 at the end of five years, and our future value reaches $129.89 at the end of 10 years.
The two graphs may look like the opposite of each other, with one decreasing over time and the other increasing, but they are instead the exact same thing - presented two different ways.
The link between the two graphs and the two types of numbers is how we determine the $77 present value today of that individual cash flow 10 years out, in the first graph. We did it by dividing one by the value of our investment with compound interest in the second graph - which is the future value - 10 years out. We start with 1, we divide by that future value of 1.2989, the result is .77, we multiply that times $100, so we pay $77 today for the $100 that we get 10 years the future, which locks in a 2.65% yield on our investment.
This above is a foundation principle for how prices and yields are determined with almost all investments. Yes, the trade can quite literally be done with bonds, it has been a lucrative trade for institutional investors with previous recessions, and at least hundreds of billions of dollars are likely to be made in practice with the next recession.
However, there are related (albeit somewhat more complex) calculations which on the most fundamental of levels help determine stock and real estate prices and returns as well. Those investment categories are where the great majority of the money is likely to be made from the application of these principles over the coming years, but it is easier to start with fewer variables and the simplicity of fixed cash flows.
So, when the Federal Reserve slams interest rates around into ever more unprecedented places in the attempt to deal with the interest rate trap that it is currently caught in - then bond, stock and real estate prices and returns also get slammed around into every more unprecedented places, with potentially extraordinary profits and losses along the way.
Seeing The Trap
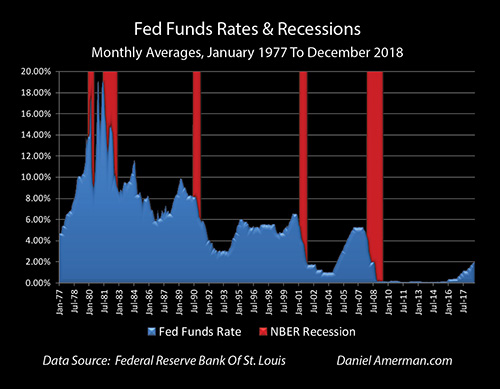
As covered in previous analyses, when we look at the red zones of recessions in the graphic above, and we compare that to the blue area of fed funds rates - we see what the Federal Reserve did every time they realized the nation was in a recession or they thought a recession is imminent. As a matter of policy, they slammed interest rates downwards.
When we look at the very small size of the blue area on the right hand side of the graph, then we can see the interest rate trap the Fed is currently caught in. The Federal Reserve has at least for now paused its cycle of increasing interest rates, for fear of inducing a recession. But because it has paused, there is nowhere near enough room to use interest rate reductions as its primary tool for shortening recession, as it has throughout the modern era. However, it can't get the "ammunition" to exit recession, without raising interest rates high enough that the act itself would likely trigger the recession.
Stuck inside this trap of its own making, the Fed has limited choices - each one of which can transform investment prices in ways that have little to do with free markets or traditional investment theory. As a starting point, if there is another recession in the next 1-2 years, then we can anticipate that Federal Reserve will slam interest rates back down to (at least) the floor of the graph, which is zero percent interest rates.
Ten year Treasury yields are not the same thing as Fed Funds rates, but when we also take into account the Fed's intentions to stack new rounds of quantitative easing on top of the still existing previous rounds of quantitative easing, further expanding the Federal Reserve balance sheet, it is reasonable to think that we could move to the lower level of a 0.5% ten year treasury yield, on a more rapid basis than the last time around.
The Source Of The Wealth
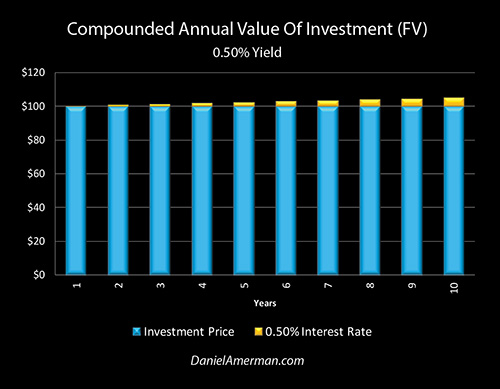
For this illustration then, let's start with the compounded value of our investment at the new 0.5% yield. It is visually obvious that the golden bars at 0.5% are far thinner than the purple bars at 2.65% over the ten years. Our $100 investment - including compound interest - now earns a cumulative total of only $5.11 over the ten years.
When we compare the $5.11 in total interest earnings at 0.5%, to the $29.89 at 2.65%, then we are only earning 17% of the total interest income. So, this means that the investment implications of the Fed being caught in it interest-rate trap coming into a potential recession and swiftly knocking rates down to zero percent short-term rates (and an assumed 0.5% rate for 10 year bonds) would be to knock down interest income by 83 percent over ten years.
There would also be ripple effects that (eventually) spread out through all other investment categories, with potentially much larger effects on stocks and on real estate over time.
Moving Wealth In Time
When we take that same equation, and we flip our perspectives and look not at future earnings but the value of those cash flows today - then the golden bars of prices at a 0.5% yield are much higher than the purple bars of prices at a 2.65% yield. The thin yellow bars of almost no interest income invert, and become the thin green bars of almost no discount.
Almost no discount means very much higher prices. So, we now start with 1, and divide by 1.0511 (our future value with compounded interest), we get .951, we then multiply times $100, and we get a price today of $95.10 at the new 0.5% yield.
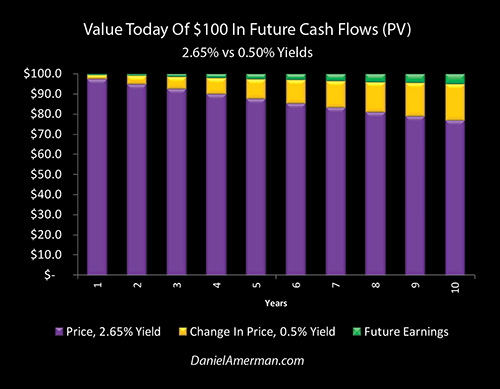
When we compare the prices, we start with the purple bar of $100 in future cash flow being worth $77 today at a 2.65% yield. We then we go to the yellow bar of 0.5% rates, and the cash flow becomes worth $95.10 which is an $18.10 gain on a $77 investment.
The source of that attractive gain - and this is mathematically absolutely necessary - is the drastic shrinkage in future interest earnings, as the purple bar of $29.89 in total earnings for a $100 investment is now down to the much thinner yellow bar of $5.11 interest earnings.
Everyone who buys interest-based investments from that time forward, whether through their ongoing deposits into retirement savings accounts or other savings - takes a crippling reduction in earnings and cash flows.
However - and this is part of the reason for starting with the simplicity of bond-based fixed cash flows - that money did not disappear. Instead, a cornered Fed using heavy-handed interventions - would as an incidental but absolutely necessary byproduct of trying to deal with its own problems, send the value of that money flying forward in time, and would thereby transfer it between different investors.
I realize that may sound a bit esoteric to some people, but it is critical for understanding the numerous new opportunities (and new risks) in a world where central banks are taking unprecedented actions, such as zero percent interest rates, negative interest rates and future rounds of quantitative easing. The old ways are no longer reliable, for the Fed is effectively collapsing the foundations of much of traditional investment theory and financial planning.
Concentrating The Wealth
The incidental byproduct of Fed actions in this case, is that years of interest earnings are stripped from many millions of investors, brought forward in time, and "caught" by a second group of investors in concentrated form. That "catch", which is what is illustrated here, is a highly attractive one time investment for a one year holding period that produces a sizzling yield out of what will otherwise be a quite toxic environment for many investments, as a recession hits and the Fed slams short-term interest rates downwards.
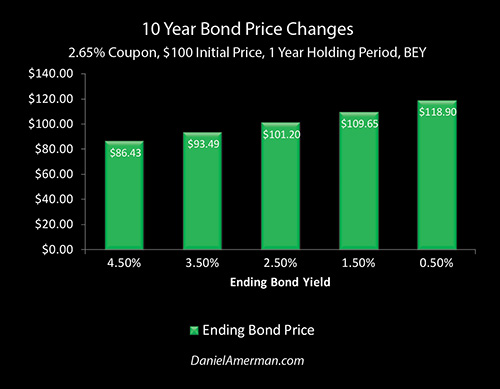
The earlier graphics show the price impact on individual cash flows that are one to ten years out. When we take into account semiannual interest, also consider only nine years being left to maturity, and consolidate those cash flows, then we get the green bars above and a bond price of $118.90.
If we go back to the earlier graphs - in each year, for each future cash flow - the annual fatter purple bar of 2.65% interest and compound interest in that year is radically narrowed down to the narrow gold bar, and the difference is brought forward in time as an increase in price. So for each individual cash flow, in each individual future year, the difference in who the cash belongs to is brought forward in time and added together.
There is a tremendous consolidation of wealth flows. In combination with the two semiannual interest payments over the one year holding period, that produces the red bars of the 21% holding period return graph which began this analysis.
That 21% is about eight times the initial 2.65% interest coupon, and 40 times the later annual yield from the bond, and where those startling multiples come from is consolidating 83% of the future wealth creation from the bond over a 9 year period, stripping that wealth creation from those investors, and pulling it all forward to a single point in time (and sale date).
Critically - once that year is over (and based on the assumptions used for this illustration), then the opportunity is gone and the strategy is over. That phase of the cycle would have already been traveled, the consolidated wealth would have all been taken, and it isn't there to be taken anymore. The fatter purple bars would not be back for another complete turn of the cycle, until we are back to a place that is one to two years before the next recession, when interest rates are hopefully at least somewhat higher again.
Now, there are at least three ways in which the profits from the strategy could be extended. One is the natural cycle of yield curve changes, in which the spread of long term yields over short term yields falls over time after the initial plunge in short term interest rates.
Another possibility is the unnatural intervention of the Fed stacking still larger QEs and balance sheet expansions on top of its first intervention, perhaps years down the round and much as it did the last time around. A third possibility is the Fed deciding that just zero percent interest rates and unnatural quantitative easing aren't enough to deal with the next recession, and it making the decision to follow Europe and Japan to the still more unnatural place of negative interest rates.
Any one of those could happen, and each could dramatically further boost the strategy profits. Of course, if one or more did happen, the enhanced bond profits would all come from the same place - stripping even more wealth creation, financial security and standard of living from many millions of savers and other investors. If this were to happen, then it could get much worse than just a nominal 83% loss of future interest income.
However, for simplicity (and to keep a lid on the length of this analysis), we will stick with a one time, one year rapid yield movement. The future holding period returns for sticking with this strategy in the years that follow would then likely be very low - and the best opportunity targets for the cycles of crisis and the containment of crisis will have mainly jumped to other investment categories.
However, for the overwhelming majority of investors - and in particular retirement investors - the wealth transfer implications of how the Fed fights recession when caught in an interest-rate trap are likely to be anything but fleeting or transient.
This next graph focuses on what many people take for granted - as being an immutable power of nature or something of the like - and that is the miracle of compound interest. Historically, the reinvestment of cash flows has been the single most reliable form of building wealth over the long term. While the term "compound interest" is generally used with the general public, the math applies to cash flows in general and works even better in other investment categories.
It is reinvested dividends that are the primary driver of reliably building wealth with stocks over the long term, and it is reinvested net cash flow that is the primary driver of reliably building wealth with real estate and REITs over the long term.
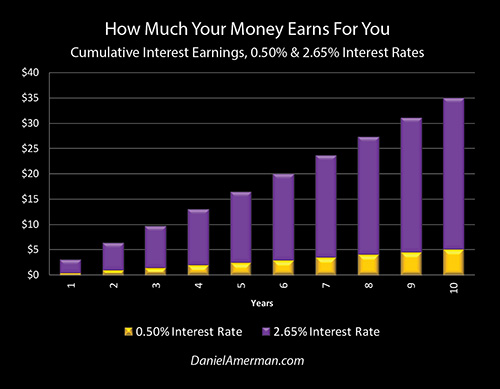
The mathematical secret to building significant wealth over the long term is not necessarily just how much one saves - but how much our money earns for us, particularly as the decades roll by. The graph above isolates cumulative interest income over 10 years at our current approximate rate of 2.65%, versus the future 0.50% ten year rate as part of the containment of the potential future recession.
The degree of reduction in how much our money earns for us over 10 years is visually stunning - we get only one sixth of the income. Yet, this is mandatory. The exact same underlying financial mathematics that create the 21% one year holding period returns as the result of how a cornered Fed contains another recession, are necessarily the same math that mandate an 83% reduction in future interest earnings for a nation over many years (with a powerful global impact as well).
For anyone who is making monthly deposits into their IRA or 401(k) - possibly employing a roboadvisor over their smartphone and using passive indexing strategies - their future compounding of wealth might only produce one sixth of they think is more or less guaranteed (and it would be much worse than that on an inflation-adjusted basis, likely producing negative real returns and negative wealth compounding over time).
For someone who is already retired and is depending on interest income to support their standard of living - the result could be a dramatic reduction in that standard of living.
In general terms - and please don't "shoot the messenger" - the Fed's past and likely future actions can have the effect of magnifying price movements, while drastically reducing the attractiveness of the traditional and less volatile "buy and hold" strategies, which are based upon the passive cash flow driven compounding of wealth. This trade-off goes down to the base fundamentals governing prices and yields in all investment categories, and means that the past becomes an ever less reliable guide for what will build wealth in the future.
A Changed Investment World
This analysis contained a concrete example of the Fed-driven transfer of wealth with bonds - that has potentially much larger implications for stocks and real estate. Whether we like it or not, the world has changed, and this new world of heavy-handed Federal Reserve interventions has already altered the very fundamentals of investing.
One aspect of this new cycle of amplified interventions is amplified losses at some points in the underlying business cycle, for reasons that are not part of traditional investment theory or financial planning. In this case, it was the potential loss of 83% of interest income - for a nation, and for many years. That may sound like a radical projection - but we already just went through something like this, and if the Fed is correct, we may be returning to that place, time and again, over the coming years and decades.
Conversely what we have seen since these amplifying cycles really kicked into gear over the last 20 or so years (as covered in my other analyses) is not the destruction of the system or monetary collapse. Instead we have seen record prices for bonds, stocks, real estate, and precious metals at different places in the cycles.
What was illustrated herein is a relatively simple example of one of the sources of where those record prices have come from in the past, and where they may come from in the future. It shows how what seems to be the dire situation of the Fed being caught in an interest rate trap as a potential new recession looms - can create explosive profits as well as losses, concentrating years of wealth transfers between investors and bringing them forward in time.
When we look at these amplified losses and the amplified profits that are the result of these amplified cycles perhaps the most important part of all is that they're not random. Rather, they can be at least partially anticipated in advance by understanding the trap that the Federal Reserve is now caught in, and by anticipating the market effects of the known strategies that the Fed has used in the past and/or intends to use in the future.
Because I believe the Fed's increasingly heavy-handed interventions have created cycles of crisis and the containment of crisis which are very important for individuals to understand, I created the framework below to help explain how these new changes in the cycles can change investment category results at various stage in the cycles.
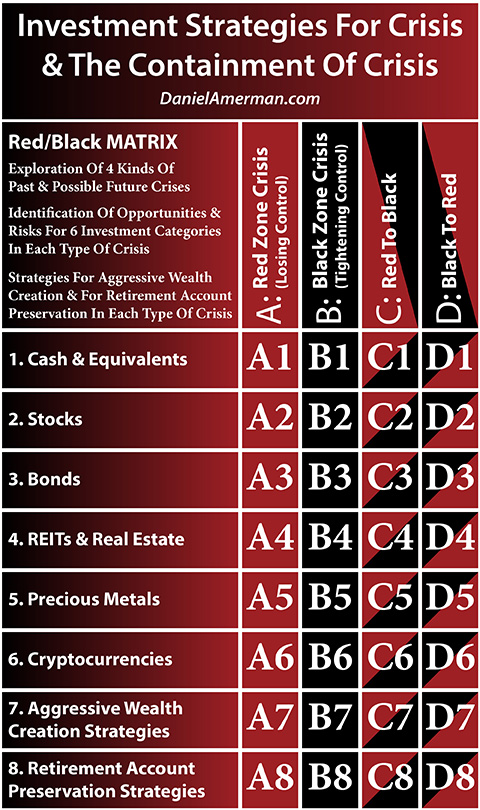
An explanatory analysis for the matrix is linked here.
In this case we have been exploring matrix cell D3, and matrix cell B3.
Cell D3 is the intersection of the D Black to Red column for the cycles, and the 3rd row, which is the investment category of bonds. As illustrated herein, investing in 10 year Treasury bonds during a one-year transition from a Black cycle of the containment of crisis to a recession induced Red cycle of crisis, would indeed produce a 21 percent holding period rate of return (contingent upon the assumptions), even as many other investment strategies would be getting crushed.
Cell B3 is the intersection of the Black B containment of crisis column, with the 3rd row investment category of bonds, and it follows the D3 cell in time, as the cycles continue to progress. Once crisis has been exited, containment has been achieved, and we move to a different column, then we are left with very low yields and holding period returns in much of the third row of bonds (at least with the assumptions in this illustration). The opportunities are far from over, but most of the best of them jump to other rows and other investment categories for the following stages in the cycles.
Many people make their investment plans based upon what I have been referring to as a "false dichotomy": either it is the mainstream where the past endlessly repeats itself, or it is straight to "gloom and doom" and financial and monetary collapse. There is a third possibility - which is the path that we have actually been travelling these last 20 or so years - where heavy-handed and amplifying Fed interventions fundamentally change how investments work compared to the mainstream and the latter half of the 20th century, but without necessarily collapsing the system either.
In such a world - both amplified profits and amplified losses will indeed exist, but they are unlikely to be found by those framing the world in "mainstream" or "gloom & doom" terms. I hope that you found this analysis to be of interest in seeing a quite different perspective on risk and return in a fundamentally different world.
*******************************